holes in trend graphs
list Dominique Frise
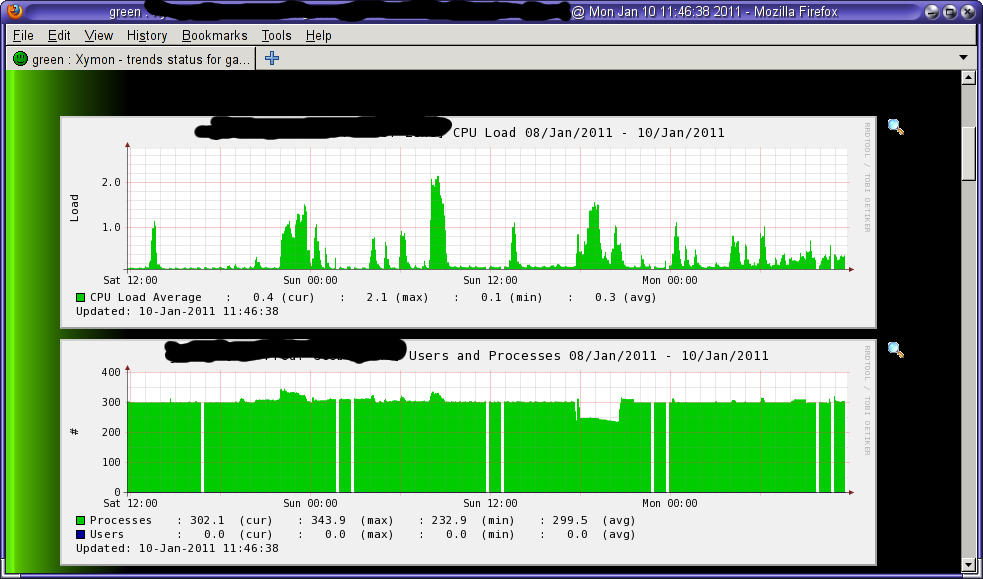
Hi,

This is probably a duplicate of http://www.xymon.com/archive/2010/01/msg00139.html

We are running xymon-4.3.0.beta3.

The "CPU Load" and "Users and Processes" graphs of the trends column show random 10min holes (see attached holes.png). The other graphs are OK.

We see this behaviour on all Solaris and MacOSX clients; Linux and Windows clients are NOT affected.
There is nothing in clientlaunch.log (client) or rrd-status.log (server)

Dominique
Attachments (1)
 attachment.png
list Dominique Frise
After enabling debug I found in rrd-status.log that rrd updates are sometimes missing for la, procs and users.

19424 2011-01-12 03:59:12 xymond_rrd: Got message 255335 @@status#255335/ares|1294801152.451202|130.223.5.23||ares|cpu|1294802952|green||green|1293728658|0||0||1294801152|sunos|intVirtServ,adminSys|0|
19424 2011-01-12 03:59:12 startpos 778821, fillpos 779667, endpos 779663
19424 2011-01-12 03:59:12 Flushing '/ares/la.rrd' with 1 updates pending, template 'la'
19424 2011-01-12 03:59:12 Flushing '/ares/procs.rrd' with 1 updates pending, template 'la'
19424 2011-01-12 03:59:12 Flushing '/ares/users.rrd' with 1 updates pending, template 'la'
19424 2011-01-12 03:59:12 Flushing '/ares/clock.rrd' with 1 updates pending, template 'la'
19424 2011-01-12 03:59:12 xymond_rrd: Got message 255336 @@status#255336/ares|1294801152.451264|130.223.5.23||ares|disk|1294802952|green||green|1293725927|0||0||1294801152|sunos|intVirtServ,adminSys|0|
[...]
19424 2011-01-12 04:04:16 xymond_rrd: Got message 257030 @@status#257030/ares|1294801456.102156|130.223.5.23||ares|cpu|1294803256|green||green|1293728658|0||0||1294801456|sunos|intVirtServ,adminSys|0|
19424 2011-01-12 04:04:16 startpos 864767, fillpos 865613, endpos 865609
19424 2011-01-12 04:04:16 Flushing '/ares/clock.rrd' with 1 updates pending, template 'la'
19424 2011-01-12 04:04:16 xymond_rrd: Got message 257031 @@status#257031/ares|1294801456.102246|130.223.5.23||ares|disk|1294803256|green||green|1293725927|0||0||1294801456|sunos|intVirtServ,adminSys|0|
[...]
19424 2011-01-12 04:09:19 xymond_rrd: Got message 258715 @@status#258715/ares|1294801759.568633|130.223.5.23||ares|cpu|1294803559|green||green|1293728658|0||0||1294801759|sunos|intVirtServ,adminSys|0|
19424 2011-01-12 04:09:19 startpos 736664, fillpos 737510, endpos 737506
19424 2011-01-12 04:09:19 Flushing '/ares/la.rrd' with 1 updates pending, template 'la'
19424 2011-01-12 04:09:19 Flushing '/ares/procs.rrd' with 1 updates pending, template 'la'
19424 2011-01-12 04:09:19 Flushing '/ares/users.rrd' with 1 updates pending, template 'la'
19424 2011-01-12 04:09:19 Flushing '/ares/clock.rrd' with 1 updates pending, template 'la'
19424 2011-01-12 04:09:19 xymond_rrd: Got message 258716 @@status#258716/ares|1294801759.568706|130.223.5.23||ares|disk|1294803559|green||green|1293725927|0||0||1294801759|sunos|intVirtServ,adminSys|0|

The three cpu-msgs above have the same size which would confirm that nothing is missing from the client.
There could be something wrong with the caching. (we have it disabled).

Anyone got an idea where to look further ?

Dominique
▸
On 01/10/11 12:23 PM, Dominique Frise wrote:Hi, This is probably a duplicate of http://www.xymon.com/archive/2010/01/msg00139.html We are running xymon-4.3.0.beta3. The "CPU Load" and "Users and Processes" graphs of the trends column show random 10min holes (see attached holes.png). The other graphs are OK. We see this behaviour on all Solaris and MacOSX clients; Linux and Windows clients are NOT affected. There is nothing in clientlaunch.log (client) or rrd-status.log (server) Dominique
list Tom L. Stewart
I believe Henrik has found and fixed this issue, but I don't know if it
is in the beta3 version. He has been talking about a new release.

Tom
▸
-----Original Message-----
From: Dominique Frise [mailto:user-78ab6673b600@xymon.invalid] Sent: Wednesday, January 12, 2011 2:08 AM
To: xymon at xymon.com
Subject: [xymon] Re: holes in trend graphs

After enabling debug I found in rrd-status.log that rrd updates are sometimes missing for la, procs and users.
19424 2011-01-12 03:59:12 xymond_rrd: Got message 255335 @@status#255335/ares|1294801152.451202|130.223.5.23||ares|cpu|1294802952
|green||green|1293728658|0||0||1294801152|sunos|intVirtServ,adminSys|0|
▸
19424 2011-01-12 03:59:12 startpos 778821, fillpos 779667, endpos 779663
19424 2011-01-12 03:59:12 Flushing '/ares/la.rrd' with 1 updates pending, template 'la'
19424 2011-01-12 03:59:12 Flushing '/ares/procs.rrd' with 1 updates pending, template 'la'
19424 2011-01-12 03:59:12 Flushing '/ares/users.rrd' with 1 updates pending, template 'la'
19424 2011-01-12 03:59:12 Flushing '/ares/clock.rrd' with 1 updates pending, template 'la'
19424 2011-01-12 03:59:12 xymond_rrd: Got message 255336 @@status#255336/ares|1294801152.451264|130.223.5.23||ares|disk|129480295
2|green||green|1293725927|0||0||1294801152|sunos|intVirtServ,adminSys|0|
[...]
19424 2011-01-12 04:04:16 xymond_rrd: Got message 257030 @@status#257030/ares|1294801456.102156|130.223.5.23||ares|cpu|1294803256
|green||green|1293728658|0||0||1294801456|sunos|intVirtServ,adminSys|0|
▸
19424 2011-01-12 04:04:16 startpos 864767, fillpos 865613, endpos 865609
19424 2011-01-12 04:04:16 Flushing '/ares/clock.rrd' with 1 updates pending, template 'la'
19424 2011-01-12 04:04:16 xymond_rrd: Got message 257031 @@status#257031/ares|1294801456.102246|130.223.5.23||ares|disk|129480325
6|green||green|1293725927|0||0||1294801456|sunos|intVirtServ,adminSys|0|
[...]
19424 2011-01-12 04:09:19 xymond_rrd: Got message 258715 @@status#258715/ares|1294801759.568633|130.223.5.23||ares|cpu|1294803559
|green||green|1293728658|0||0||1294801759|sunos|intVirtServ,adminSys|0|
▸
19424 2011-01-12 04:09:19 startpos 736664, fillpos 737510, endpos 737506
19424 2011-01-12 04:09:19 Flushing '/ares/la.rrd' with 1 updates pending, template 'la'
19424 2011-01-12 04:09:19 Flushing '/ares/procs.rrd' with 1 updates pending, template 'la'
19424 2011-01-12 04:09:19 Flushing '/ares/users.rrd' with 1 updates pending, template 'la'
19424 2011-01-12 04:09:19 Flushing '/ares/clock.rrd' with 1 updates pending, template 'la'
19424 2011-01-12 04:09:19 xymond_rrd: Got message 258716 @@status#258716/ares|1294801759.568706|130.223.5.23||ares|disk|129480355
9|green||green|1293725927|0||0||1294801759|sunos|intVirtServ,adminSys|0|
▸
The three cpu-msgs above have the same size which would confirm that nothing is missing from the client.
There could be something wrong with the caching. (we have it disabled).

Anyone got an idea where to look further ?

Dominique

On 01/10/11 12:23 PM, Dominique Frise wrote:
Hi, This is probably a duplicate of http://www.xymon.com/archive/2010/01/msg00139.html We are running xymon-4.3.0.beta3. The "CPU Load" and "Users and Processes" graphs of the trends column show random 10min holes (see attached holes.png). The other graphs are
OK.
We see this behaviour on all Solaris and MacOSX clients; Linux and
Windows clients are NOT affected.
There is nothing in clientlaunch.log (client) or rrd-status.log
(server)
Dominique
list Hermann-Josef Beckers
Dominique Frise <user-78ab6673b600@xymon.invalid> schrieb am 10.01.2011 12:23:15:
▸
...This is probably a duplicate of http://www.xymon.com/archive/2010/01/msg00139.html We are running xymon-4.3.0.beta3. The "CPU Load" and "Users and Processes" graphs of the trends column show random 10min holes (see attached holes.png). The other graphs are
OK.
We see this behaviour on all Solaris and MacOSX clients; Linux and Windows clients are NOT affected.
...
 I see them also on Linux clients (openSuse 11.x). The holes are up
to 20 minutes.
Yours
hjb
list Jeremy Laidman
Has anyone made progress with this?  I have the exact same problem
with no solution and nothing interesting in the logs.  As soon as I
disable caching on xymond_rrd, the gaps go away.

However as soon as I did this, the graphs for "cpu load" and "users
and processes" both stopped updating completely.  All other trend
graphs are perfect.  None of the network tests had a problem, so this
seems to be restricted to numbers coming from the xymon client as
"client data".
▸
-----Original Message-----
From: "Stewart, Tom L." <user-f210f371749e@xymon.invalid>
Date: Wed, 12 Jan 2011 09:18:03 -0600
To: xymon (at) xymon.com
Subject: [xymon] Re: holes in trend graphs

I believe Henrik has found and fixed this issue, but I don't know if it
is in the beta3 version. He has been talking about a new release.

Tom

-----Original Message-----
From: Dominique Frise [mailto:user-78ab6673b600@xymon.invalid]
Sent: Wednesday, January 12, 2011 2:08 AM
To: xymon (at) xymon.com
Subject: [xymon] Re: holes in trend graphs
list Tom L. Stewart
I put a note in last week saying I was having the same issue in the 4.3
release and looks like the same issue that was in the beta. The holes
are totally random and I asked if the --no-cache still works the same in
the xymond_rrd, but I have not seen anyone respond.

Tom

-----Original Message-----
From: xymon-bounces at xymon.com [mailto:xymon-bounces at xymon.com] On Behalf
Of Jeremy Laidman
Sent: Wednesday, March 23, 2011 9:44 PM
▸
To: xymon at xymon.com
Subject: [Xymon] [xymon] Re: holes in trend graphs

Has anyone made progress with this?  I have the exact same problem
with no solution and nothing interesting in the logs.  As soon as I
disable caching on xymond_rrd, the gaps go away.

However as soon as I did this, the graphs for "cpu load" and "users
and processes" both stopped updating completely.  All other trend
graphs are perfect.  None of the network tests had a problem, so this
seems to be restricted to numbers coming from the xymon client as
"client data".

-----Original Message-----
From: "Stewart, Tom L." <user-f210f371749e@xymon.invalid>
Date: Wed, 12 Jan 2011 09:18:03 -0600
To: xymon (at) xymon.com
Subject: [xymon] Re: holes in trend graphs

I believe Henrik has found and fixed this issue, but I don't know if it
is in the beta3 version. He has been talking about a new release.

Tom

-----Original Message-----
From: Dominique Frise [mailto:user-78ab6673b600@xymon.invalid]
Sent: Wednesday, January 12, 2011 2:08 AM
To: xymon (at) xymon.com
Subject: [xymon] Re: holes in trend graphs
list Jeremy Laidman
Tom, do you get the same as me with the "--no-cache" option:
1) gaps for most trend graphs go away
2) trend graphs for "cpu" and "users and processes" went to zero (actually NaN)

J

On Fri, Mar 25, 2011 at 12:35 AM, Stewart, Tom L.
▸
<user-f210f371749e@xymon.invalid> wrote:I put a note in last week saying I was having the same issue in the 4.3 release and looks like the same issue that was in the beta. The holes are totally random and I asked if the --no-cache still works the same in the xymond_rrd, but I have not seen anyone respond. Tom -----Original Message----- From: xymon-bounces at xymon.com [mailto:xymon-bounces at xymon.com] On Behalf Of Jeremy Laidman Sent: Wednesday, March 23, 2011 9:44 PM To: xymon at xymon.com Subject: [Xymon] [xymon] Re: holes in trend graphs Has anyone made progress with this? I have the exact same problem with no solution and nothing interesting in the logs. As soon as I disable caching on xymond_rrd, the gaps go away. However as soon as I did this, the graphs for "cpu load" and "users and processes" both stopped updating completely. All other trend graphs are perfect. None of the network tests had a problem, so this seems to be restricted to numbers coming from the xymon client as "client data". -----Original Message----- From: "Stewart, Tom L." <user-f210f371749e@xymon.invalid> Date: Wed, 12 Jan 2011 09:18:03 -0600 To: xymon (at) xymon.com Subject: [xymon] Re: holes in trend graphs I believe Henrik has found and fixed this issue, but I don't know if it is in the beta3 version. He has been talking about a new release. Tom -----Original Message----- From: Dominique Frise [mailto:user-78ab6673b600@xymon.invalid] Sent: Wednesday, January 12, 2011 2:08 AM To: xymon (at) xymon.com Subject: [xymon] Re: holes in trend graphs
list Tom L. Stewart
No, it seems I get fewer gaps using --no-cache, but it has always only affected the "cpu" and "users and processes" graphs. When I can catch the missing data in process, I see that the rrd is never updated or timestamped, but I never see any type of error message in any of the log files.

I also forget to mention that I am only using one setting for the rrd definitions and I do have the extra-rrd definition for the soloris MP and Zone stats.

Here is what the configuration file looks like for the rrd... stuff in tasks.cfg.

 # "rrdstatus" updates RRD files with information that arrives as "status" messages.
[rrdstatus]
        ENVFILE /home/xymon/server/etc/xymonserver.cfg
        NEEDS xymond
        CMD xymond_channel --channel=status --log=$XYMONSERVERLOGS/rrd-status.log xymond_rrd --no-cache --rrddir=$XYMONVAR/rrd

# "rrddata" updates RRD files with information that arrives as "data" messages.
[rrddata]
        ENVFILE /home/xymon/server/etc/xymonserver.cfg
        NEEDS xymond
        CMD xymond_channel --channel=data  --log=$XYMONSERVERLOGS/rrd-data.log xymond_rrd --no-cache --rrddir=$XYMONVAR/rrd --extra-te
sts=mpstat,zonestat --extra-script=/home/xymon/server/ext/rrd_data.pl

And here is the rrddefinitions.cfg file for only what I have changed.

# This one is the default setup. You can change it, if you like.
[]
        # 576 datapoints w/ 5 minute interval = 48 hours @ 5 min avg.
        RRA:AVERAGE:0.5:1:82944
        # 576 datapoints w/ 6*5 minute averaged = 12 days @ 5 min avg.
        #RRA:AVERAGE:0.5:6:82944 **** NOT USED ****
        # 576 datapoints w/ 24*5 minute averaged = 48 days @ 5 min avg.
        #RRA:AVERAGE:0.5:24:82944 **** NOT USED ****
        # 576 datapoints w/ 288*5 minute averaged = 576 days @ 5 min avg.
        #RRA:AVERAGE:0.5:288:82944 **** NOT USED ****

Tom
▸
-----Original Message-----
From: Jeremy Laidman [mailto:user-71895fb2e44c@xymon.invalid]
Sent: Monday, March 28, 2011 9:42 PM
To: Stewart, Tom L.
Cc: xymon at xymon.com
Subject: Re: [Xymon] [xymon] Re: holes in trend graphs

Tom, do you get the same as me with the "--no-cache" option:
1) gaps for most trend graphs go away
2) trend graphs for "cpu" and "users and processes" went to zero (actually NaN)

J

On Fri, Mar 25, 2011 at 12:35 AM, Stewart, Tom L.
<user-f210f371749e@xymon.invalid> wrote:
I put a note in last week saying I was having the same issue in the 4.3 release and looks like the same issue that was in the beta. The holes are totally random and I asked if the --no-cache still works the same in the xymond_rrd, but I have not seen anyone respond. Tom -----Original Message----- From: xymon-bounces at xymon.com [mailto:xymon-bounces at xymon.com] On Behalf Of Jeremy Laidman Sent: Wednesday, March 23, 2011 9:44 PM To: xymon at xymon.com Subject: [Xymon] [xymon] Re: holes in trend graphs Has anyone made progress with this? I have the exact same problem with no solution and nothing interesting in the logs. As soon as I disable caching on xymond_rrd, the gaps go away. However as soon as I did this, the graphs for "cpu load" and "users and processes" both stopped updating completely. All other trend graphs are perfect. None of the network tests had a problem, so this seems to be restricted to numbers coming from the xymon client as "client data". -----Original Message----- From: "Stewart, Tom L." <user-f210f371749e@xymon.invalid> Date: Wed, 12 Jan 2011 09:18:03 -0600 To: xymon (at) xymon.com Subject: [xymon] Re: holes in trend graphs I believe Henrik has found and fixed this issue, but I don't know if it is in the beta3 version. He has been talking about a new release. Tom -----Original Message----- From: Dominique Frise [mailto:user-78ab6673b600@xymon.invalid] Sent: Wednesday, January 12, 2011 2:08 AM To: xymon (at) xymon.com Subject: [xymon] Re: holes in trend graphs
list Henrik Størner
On Tue, 29 Mar 2011 09:47:18 -0500, "Stewart, Tom L."
▸
<user-f210f371749e@xymon.invalid> wrote:No, it seems I get fewer gaps using --no-cache, but it has always only affected the "cpu" and "users and processes" graphs.
I can see two possible causes for this.

1) There's a bug in the xymond_rrd module, so updates never make it to the
rrd file.

2) There's some data missing from the client report, so there is no data
to put into the rrd file. This can happen, e.g. if the client data message
is too large so it gets truncated - which part of the client message is
lost depends on the size of the message, and the sequence in which the
individual sections (ps listing, network ports, log messages etc) are added
to the client message.

I would like to try and see if the data really make it into the RRD
module. There is an un-documented option to xymond_rrd that causes all data
that should go into the RRD files to be dumped to an external command -
this should tell us if there is any data show up at all.

So create this little shell script:

#!/bin/sh
cat >/var/tmp/rrdfeed.txt
exit 0

Save it somewhere - /usr/local/bin/rrddump.sh - then add
"--processor=/usr/local/bin/rrddump.sh" to the xymond_rrd commandline in
tasks.cfg. It will log an entry to the rrd logfile that the processor has
started. Each time an update occurs, it will write a line to the
rrdfeed.txt file, containing (among other things) the RRD filename, the
hostname, and the data that should go into the RRD file (which includes a
timestamp). This is logged *before* any of the RRD cache handling occurs.

So grep'ing for the RRD filename after a while when there are holes in the
graph should tell us if there are any data missing.


Regards,
Henrik
list Tom L. Stewart
I have added the script and will send the info when it happens again.

Thank you,
▸
Tom

-----Original Message-----
From: xymon-bounces at xymon.com [mailto:xymon-bounces at xymon.com] On Behalf
Of user-ce4a2c883f75@xymon.invalid
Sent: Wednesday, March 30, 2011 4:13 AM
▸
To: xymon at xymon.com
Subject: Re: [Xymon] [xymon] Re: holes in trend graphs

On Tue, 29 Mar 2011 09:47:18 -0500, "Stewart, Tom L."
<user-f210f371749e@xymon.invalid> wrote:
No, it seems I get fewer gaps using --no-cache, but it has always only affected the "cpu" and "users and processes" graphs.
I can see two possible causes for this.

1) There's a bug in the xymond_rrd module, so updates never make it to
the
rrd file.

2) There's some data missing from the client report, so there is no data
to put into the rrd file. This can happen, e.g. if the client data
message
is too large so it gets truncated - which part of the client message is
lost depends on the size of the message, and the sequence in which the
individual sections (ps listing, network ports, log messages etc) are
added
to the client message.

I would like to try and see if the data really make it into the RRD
module. There is an un-documented option to xymond_rrd that causes all
data
that should go into the RRD files to be dumped to an external command -
this should tell us if there is any data show up at all.

So create this little shell script:

#!/bin/sh
cat >/var/tmp/rrdfeed.txt
exit 0

Save it somewhere - /usr/local/bin/rrddump.sh - then add
"--processor=/usr/local/bin/rrddump.sh" to the xymond_rrd commandline in
tasks.cfg. It will log an entry to the rrd logfile that the processor
has
started. Each time an update occurs, it will write a line to the
rrdfeed.txt file, containing (among other things) the RRD filename, the
hostname, and the data that should go into the RRD file (which includes
a
timestamp). This is logged *before* any of the RRD cache handling
occurs.

So grep'ing for the RRD filename after a while when there are holes in
the
graph should tell us if there are any data missing.


Regards,
Henrik
list Jeremy Laidman
On Wed, Mar 30, 2011 at 8:12 PM, <user-ce4a2c883f75@xymon.invalid> wrote:
#!/bin/sh
cat >/var/tmp/rrdfeed.txt
exit 0
... and "chmod +x" the file.

I have a gap in my graph for "memory.actual" right now.

$ strings /var/tmp/rrdfeed.txt |egrep " dnsadm2.in.*actual"|tail
realmempct 1301533439:4 dnsadm2.in.X.com.au memory actual
realmempct 1301533739:4 dnsadm2.in.X.com.au memory actual
realmempct 1301533739:4 dnsadm2.in.X.com.au memory actual
realmempct 1301534039:4 dnsadm2.in.X.com.au memory actual
realmempct 1301534339:4 dnsadm2.in.X.com.au memory actual
realmempct 1301534639:4 dnsadm2.in.X.com.au memory actual

$ rrdtool fetch
/var/lib/xymon/rrd/dnsadm2.in.X.com.au/memory.actual.rrd AVERAGE |
tail
1301532300: 4.0000000000e+00
1301532600: 4.0000000000e+00
1301532900: 4.0000000000e+00
1301533200: 4.0000000000e+00
1301533500: 4.0000000000e+00
1301533800: nan
1301534100: nan
1301534400: nan
1301534700: nan
1301535000: nan
list Jeremy Laidman
On Thu, Mar 31, 2011 at 12:29 PM, Jeremy Laidman
<user-71895fb2e44c@xymon.invalid> wrote:
I have a gap in my graph for "memory.actual" right now.
Hmm.  In the end, I did some adjustments to my two xymon servers to
only list themselves as display servers, rather than each listing both
servers.  Otherwise I was getting multiple messages passing from one
to the other, and I reckon this was causing problems, possibly this
one too.

After a reboot, I lost the "--processor" script, and since removing
the configuration for it, I now get graphs on both servers, and
neither has gaps.  I'm happy, even though I'm not entirely sure of the
cause.  But I suspect it's a bad thing to list more than one display
server on a display server.

Cheers
Jeremy
list Tom L. Stewart
I have the same issue, and I have sent Henrik some data. I know he has
been occupied with the eye stuff, so I didn't want to send additional
data until he is better.
▸
Tom

-----Original Message-----
From: xymon-bounces at xymon.com [mailto:xymon-bounces at xymon.com] On Behalf
Of Jeremy Laidman
Sent: Thursday, May 05, 2011 10:27 PM
▸
To: xymon at xymon.com
Subject: Re: [Xymon] [xymon] Re: holes in trend graphs

On Thu, Mar 31, 2011 at 12:29 PM, Jeremy Laidman
<user-71895fb2e44c@xymon.invalid> wrote:
I have a gap in my graph for "memory.actual" right now.
Hmm.  In the end, I did some adjustments to my two xymon servers to
only list themselves as display servers, rather than each listing both
servers.  Otherwise I was getting multiple messages passing from one
to the other, and I reckon this was causing problems, possibly this
one too.

After a reboot, I lost the "--processor" script, and since removing
the configuration for it, I now get graphs on both servers, and
neither has gaps.  I'm happy, even though I'm not entirely sure of the
cause.  But I suspect it's a bad thing to list more than one display
server on a display server.

Cheers
Jeremy