Help with graphs
list Greg Shea
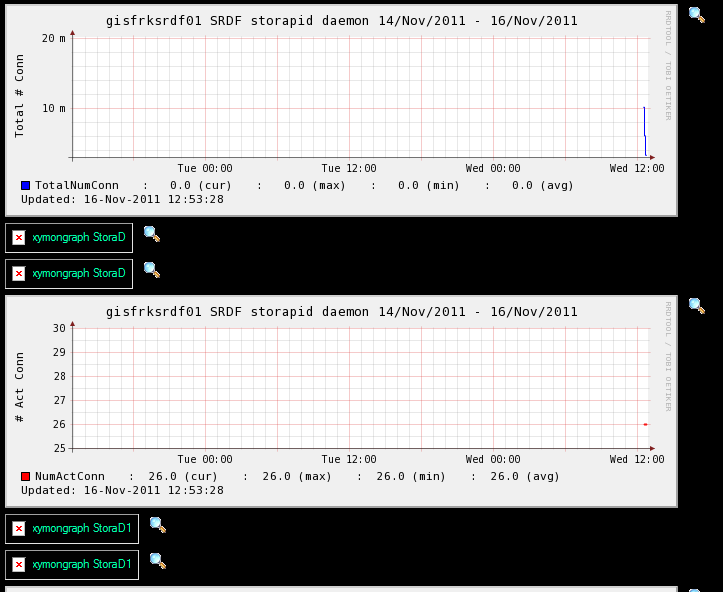
Hi all, another long winded one I'm afraid :)

From one Perl script I test the status of 3 separate daemons, pretty up the output and forward that off to my Xymon 4.3.5 server.
I want the service column StoraD with the command output, I don't want a graph on that page, and I do want all graphs in Trends.

Below is the debug output and for the actual statuses I change the ':' to the HTML equivalent ' :', except for the data I want to graph
which is in the hidden HTML tags <!-- ... -->.  Great, data comes in fine, I use SPLITNCV because I want to graph each one individually,
so 9 graphs total.  For each graph I have 1 complete graph and 2 broken links boxes.  When I right click and copy shortcut on all three boxes
I get the following, and the only thing that's different is 'first=' either 1,5, or 9

Any help would be appreciated
Thanks
Greg Shea
EMC Corporation

http://yxmprdr02/xymon-cgi/showgraph.sh?host=gisfrksrdf01&service=StoraD&graph_width=576&graph_height=120&first=1&count=4&disp=gisfrksrdf01&graph_start=1321293207&graph_end=1321466007&action=menu

http://yxmprdr02/xymon-cgi/showgraph.sh?host=gisfrksrdf01&service=StoraD&graph_width=576&graph_height=120&first=5&count=4&disp=gisfrksrdf01&graph_start=1321293207&graph_end=1321466007&action=menu

http://yxmprdr02/xymon-cgi/showgraph.sh?host=gisfrksrdf01&service=StoraD&graph_width=576&graph_height=120&first=9&count=4&disp=gisfrksrdf01&graph_start=1321293207&graph_end=1321466007&action=menu

[cid:image001.png at 01CCA45E.6537D260]

excerpt from hosts.cfg
10.10.10.10   gisfrksrdf01            # TRENDS:*,StoraD:StoraD|StoraD1|StoraD2|StoraD3|StoraD4|StoraD5|StoraD6|StoraD7|StoraD8

excerpt from xymonserver.cfg
TEST2RRD="... StoraD=ncv"
GRAPHS="... StoraD::1"
SPLITNCV_StoraD="pidTNC:DERIVE,pidNAC:GAUGE,pidTNR:DERIVE,gnsdTNC:DERIVE,gnsdNAC:GAUGE,gnsdTNR:DERIVE,rdfdTNC:DERIVE,rdfdNAC:GAUGE,rdfdTNR:DERIVE,*:NONE"

excerpt from graphs.cfg
[StoraD]
        TITLE SRDF storapid daemon
        YAXIS Total # Conn
        DEF:TNC=StoraD,pidTNC.rrd:lambda:AVERAGE
        LINE1:TNC#0000FF:TotalNumConn
        GPRINT:TNC:LAST: \: %5.1lf (cur)
        GPRINT:TNC:MAX: \: %5.1lf (max)
        GPRINT:TNC:MIN: \: %5.1lf (min)
        GPRINT:TNC:AVERAGE: \: %5.1lf (avg)\n

[StoraD1]
        TITLE SRDF storapid daemon
        YAXIS # Act Conn
        DEF:NAC=StoraD,pidNAC.rrd:lambda:AVERAGE
        LINE2:NAC#FF0000:NumActConn
        GPRINT:NAC:LAST: \: %5.1lf (cur)
        GPRINT:NAC:MAX: \: %5.1lf (max)
        GPRINT:NAC:MIN: \: %5.1lf (min)
        GPRINT:NAC:AVERAGE: \: %5.1lf (avg)\n

[StoraD2]
        TITLE SRDF storapid daemon
        YAXIS Total # Req
        DEF:TNR=StoraD,pidTNR.rrd:lambda:AVERAGE
        LINE3:TNR#00CC00:TotNumReq
        GPRINT:TNR:LAST: \: %5.1lf (cur)
        GPRINT:TNR:MAX: \: %5.1lf (max)
        GPRINT:TNR:MIN: \: %5.1lf (min)
        GPRINT:TNR:AVERAGE: \: %5.1lf (avg)\n
...
[StoraD8]


debug output from script
/apps/hobbit/client/bin/bb 0.0.0.0 "status gisfrksrdf01.StoraD green Tue Nov 15 16:15:07 EST 2011 - EMAS -
===========================================================================
<FONT SIZE=+2><B> /usr/symcli/bin/stordaemon show storapid</B></FONT>
  Daemon State                                    : Running
  Daemon Start Time                               : Thu Sep 22 10:49:38 2011
  Version                                         : V7.3-1214 (0.1)
  Auto-Restart by Watchdog                        : Enabled

  Total Number of Connections                     : 746
  Number of Active Connections                    : 26
  Total Number of Requests                        : 19481043

  Gatekeeper Management                           :
  Gatekeeper (GK) Management State                : Running
  GK Management Total open GKs                    : 2
  GK Management open GKs highwater                : 9
  Allow PPath Native Devs as GKs                  : N/A
  Total File Descriptors                          : 48

===========================================================================
<FONT SIZE=+2><B> /usr/symcli/bin/stordaemon show storgnsd</B></FONT>
  Daemon State                                    : Running
  Daemon Start Time                               : Mon Oct 17 08:49:28 2011
  Version                                         : V7.3-1214 (0.1)
  Auto-Restart by Watchdog                        : Enabled

  Total Number of Connections                     : 264
  Number of Active Connections                    : 0
  Total Number of Requests                        : 382

===========================================================================
<FONT SIZE=+2><B> /usr/symcli/bin/stordaemon show storrdfd</B></FONT>
  Daemon State                                    : Running
  Daemon Start Time                               : Thu Sep 22 11:04:06 2011
  Version                                         : V7.3-1214 (0.1)
  Auto-Restart by Watchdog                        : Enabled

  Total Number of Connections                     : 210
  Number of Active Connections                    : 1
  Total Number of Requests                        : 79133


<!--
pidTNC : 746
pidNAC : 26
pidTNR : 19481043

-->

<!--
gnsdTNC : 264
gnsdNAC : 0
gnsdTNR : 382

-->

<!--
rdfdTNC : 210
rdfdNAC : 1
rdfdTNR : 79133

-->

"
Attachments (1)
 attachment.png