CPU USAGE DISPLAY (CPU Statistics)
list Mark Felder
On Jul 23, 2014, at 10:51, Schwab, Jos <user-2b687a9b0cb4@xymon.invalid> wrote:
Hello everyone,
          I am pretty new to the Linux world. Getting to the point quickly; xymon apparently uses the top display for the CPU display. When I see a CPU alert from xymon I’d like to see the current time interval’s CPU stats (The third line of top display - %us, %sy, %ni, etc) rather than the averages of those stats since the last reboot of the machine. This is an old ‘complaint’ in bugzilla which was closed in 2007 as ‘not a bug’. I couldn’t find any work-arounds or customizing tips out there to change the display in xymon. What changes can a person make to see the current time interval (any top display other than the first one) statistics for the cpu display in xymon? What about changes in the monitored OS? Any suggestions are appreciated! Thanks.
I think I know what you are asking for, but to be sure can you define what you mean by "current time interval" ?


Thanks!
list Jos Schwab
Sorry for the delay mark. I took off a couple of days.
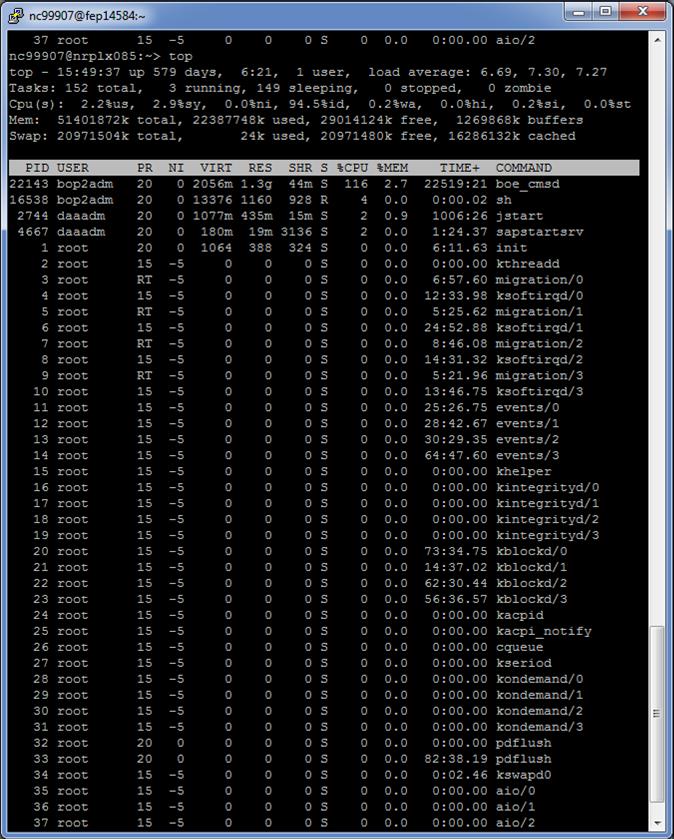
By interval I mean the time span that is used for the calculations in the cpu stats in the third line of TOP. The first display is calculated across the time since boot. The second 'interval' is the time calculated for those same cpu stats since the last iteration of the TOP display which is...well... it looks like 1 or 2 seconds. Thus that is what I mean by 'interval'. Interval is whatever is the measured period of time over which any given TOP display's cpu statistics are calculated. Xymon shows the first display of TOP which looks like the first screen shot below. Then from the same server virtually a few seconds later, I captured a second display of TOP. Notice the cpu statistics are very different even though the REAL condition of the server hadn't changed at all. I would like to change xymon to display that second iteration of the TOP command.
Let me know if you would like more clarification. Thanks! :)
Jos Schwab
Office - XXX-XXX-XXXX
Mobile - XXX-XXX-XXXX
SAP Technical Engineer
XX East Stephenson Street
Freeport, Il. 61032
user-2b687a9b0cb4@xymon.invalid
▸
-----Original Message-----
From: Mark Felder [mailto:user-db141d317836@xymon.invalid]
Sent: Wednesday, July 23, 2014 5:40 PM
To: Schwab, Jos
Cc: xymon at xymon.com
Subject: Re: [Xymon] CPU USAGE DISPLAY (CPU Statistics)


On Jul 23, 2014, at 10:51, Schwab, Jos <user-2b687a9b0cb4@xymon.invalid<mailto:user-2b687a9b0cb4@xymon.invalid>> wrote:
Hello everyone,
          I am pretty new to the Linux world. Getting to the point quickly; xymon apparently uses the top display for the CPU display. When I see a CPU alert from xymon I'd like to see the current time interval's CPU stats (The third line of top display - %us, %sy, %ni, etc) rather than the averages of those stats since the last reboot of the machine. This is an old 'complaint' in bugzilla which was closed in 2007 as 'not a bug'. I couldn't find any work-arounds or customizing tips out there to change the display in xymon. What changes can a person make to see the current time interval (any top display other than the first one) statistics for the cpu display in xymon? What about changes in the monitored OS? Any suggestions are appreciated! Thanks.
I think I know what you are asking for, but to be sure can you define what you mean by "current time interval" ?


Thanks!
Attachments (2)
 attachment.jpg
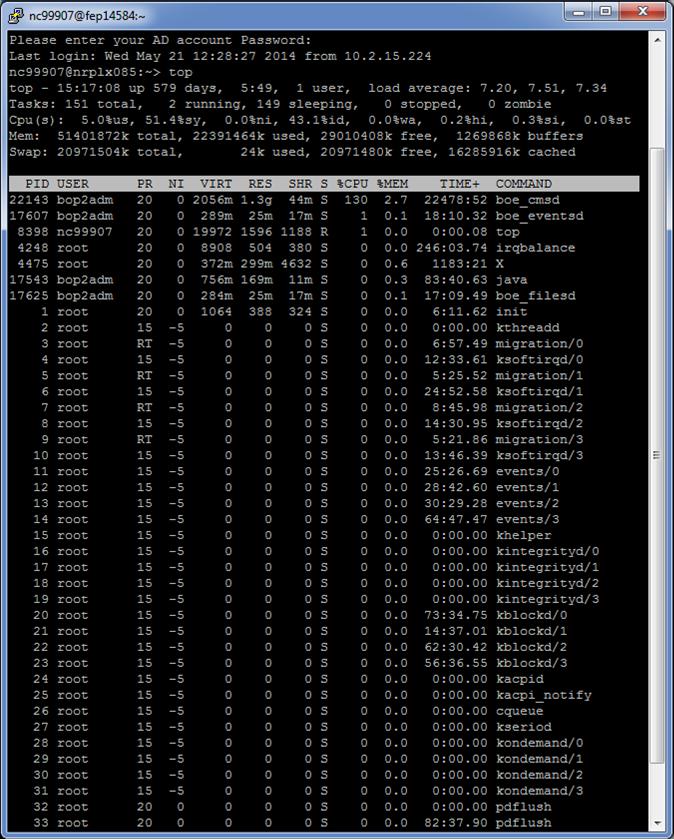 attachment-0001.jpg
list Jos Schwab
Mark,
        I failed to mention that in the man pages for TOP in CentOS 6.5, the -d command line option is called the interval which I had read somewhere is used to average statistics over. I hope that helps make it more clear and understandable.
▸
Jos Schwab
Office - XXX-XXX-XXXX
Mobile - XXX-XXX-XXXX
SAP Technical Engineer
XX East Stephenson Street
Freeport, Il. 61032

user-2b687a9b0cb4@xymon.invalid
▸
From: Schwab, Jos
Sent: Tuesday, July 29, 2014 10:19 AM
To: 'Mark Felder'
Cc: xymon at xymon.com
Subject: RE: [Xymon] CPU USAGE DISPLAY (CPU Statistics)


        Sorry for the delay mark. I took off a couple of days.

        By interval I mean the time span that is used for the calculations in the cpu stats in the third line of TOP. The first display is calculated across the time since boot. The second 'interval' is the time calculated for those same cpu stats since the last iteration of the TOP display which is...well... it looks like 1 or 2 seconds. Thus that is what I mean by 'interval'. Interval is whatever is the measured period of time over which any given TOP display's cpu statistics are calculated. Xymon shows the first display of TOP which looks like the first screen shot below. Then from the same server virtually a few seconds later, I captured a second display of TOP. Notice the cpu statistics are very different even though the REAL condition of the server hadn't changed at all. I would like to change xymon to display that second iteration of the TOP command.

        Let me know if you would like more clarification. Thanks! :)
         << OLE Object: Picture (Device Independent Bitmap) >>
 << OLE Object: Picture (Device Independent Bitmap) >>
▸
Jos Schwab
Office - XXX-XXX-XXXX
Mobile - XXX-XXX-XXXX
SAP Technical Engineer
XX East Stephenson Street
Freeport, Il. 61032

user-2b687a9b0cb4@xymon.invalid


-----Original Message-----
▸
From: Mark Felder [mailto:user-db141d317836@xymon.invalid]
Sent: Wednesday, July 23, 2014 5:40 PM
To: Schwab, Jos
Cc: xymon at xymon.com
Subject: Re: [Xymon] CPU USAGE DISPLAY (CPU Statistics)


On Jul 23, 2014, at 10:51, Schwab, Jos <user-2b687a9b0cb4@xymon.invalid<mailto:user-2b687a9b0cb4@xymon.invalid>> wrote:
Hello everyone,
          I am pretty new to the Linux world. Getting to the point quickly; xymon apparently uses the top display for the CPU display. When I see a CPU alert from xymon I'd like to see the current time interval's CPU stats (The third line of top display - %us, %sy, %ni, etc) rather than the averages of those stats since the last reboot of the machine. This is an old 'complaint' in bugzilla which was closed in 2007 as 'not a bug'. I couldn't find any work-arounds or customizing tips out there to change the display in xymon. What changes can a person make to see the current time interval (any top display other than the first one) statistics for the cpu display in xymon? What about changes in the monitored OS? Any suggestions are appreciated! Thanks.
I think I know what you are asking for, but to be sure can you define what you mean by "current time interval" ?


Thanks!
list Jos Schwab
Mark,
        Lastly, I also see in the man pages for TOP in the bugs section (again on CentOS) the TOP author speaks to this very topic. He calls the intervals samples.  Here is that except:

7. BUGS
       Send bug reports to:
          Albert D. Cahalan, <user-789fe4fc1e68@xymon.invalid>

       The top command calculates Cpu(s) by looking at the change in CPU time values between  samples.  When
       you  first  run it, it has no previous sample to compare to, so these initial values are the percent-
       ages since boot. It means you need at least two loops or you have to ignore summary output  from  the
       first loop.  This is problem for example for batch mode. There is a possible workaround if you define
       the CPULOOP=1 environment variable. The top command will be run one extra hidden loop  for  CPU  data
       before standard output.
▸
Jos Schwab
Office - XXX-XXX-XXXX
Mobile - XXX-XXX-XXXX
SAP Technical Engineer
XX East Stephenson Street
Freeport, Il. 61032

user-2b687a9b0cb4@xymon.invalid
▸
From: Schwab, Jos
Sent: Tuesday, July 29, 2014 10:56 AM
To: 'Mark Felder'
Cc: 'xymon at xymon.com'
Subject: RE: [Xymon] CPU USAGE DISPLAY (CPU Statistics)


Mark,
        I failed to mention that in the man pages for TOP in CentOS 6.5, the -d command line option is called the interval which I had read somewhere is used to average statistics over. I hope that helps make it more clear and understandable.


Jos Schwab
Office - XXX-XXX-XXXX
Mobile - XXX-XXX-XXXX
SAP Technical Engineer
XX East Stephenson Street
Freeport, Il. 61032
user-2b687a9b0cb4@xymon.invalid<mailto:user-2b687a9b0cb4@xymon.invalid>
▸
From: Schwab, Jos
Sent: Tuesday, July 29, 2014 10:19 AM
To: 'Mark Felder'
Cc: xymon at xymon.com<mailto:xymon at xymon.com>
Subject: RE: [Xymon] CPU USAGE DISPLAY (CPU Statistics)


        Sorry for the delay mark. I took off a couple of days.

        By interval I mean the time span that is used for the calculations in the cpu stats in the third line of TOP. The first display is calculated across the time since boot. The second 'interval' is the time calculated for those same cpu stats since the last iteration of the TOP display which is...well... it looks like 1 or 2 seconds. Thus that is what I mean by 'interval'. Interval is whatever is the measured period of time over which any given TOP display's cpu statistics are calculated. Xymon shows the first display of TOP which looks like the first screen shot below. Then from the same server virtually a few seconds later, I captured a second display of TOP. Notice the cpu statistics are very different even though the REAL condition of the server hadn't changed at all. I would like to change xymon to display that second iteration of the TOP command.

        Let me know if you would like more clarification. Thanks! :)

         << OLE Object: Picture (Device Independent Bitmap) >>
 << OLE Object: Picture (Device Independent Bitmap) >>

Jos Schwab
Office - XXX-XXX-XXXX
Mobile - XXX-XXX-XXXX
SAP Technical Engineer
XX East Stephenson Street
Freeport, Il. 61032
user-2b687a9b0cb4@xymon.invalid<mailto:user-2b687a9b0cb4@xymon.invalid>
▸
-----Original Message-----
From: Mark Felder [mailto:user-db141d317836@xymon.invalid]
Sent: Wednesday, July 23, 2014 5:40 PM
To: Schwab, Jos
Cc: xymon at xymon.com<mailto:xymon at xymon.com>
Subject: Re: [Xymon] CPU USAGE DISPLAY (CPU Statistics)


On Jul 23, 2014, at 10:51, Schwab, Jos <user-2b687a9b0cb4@xymon.invalid<mailto:user-2b687a9b0cb4@xymon.invalid>> wrote:
Hello everyone,
          I am pretty new to the Linux world. Getting to the point quickly; xymon apparently uses the top display for the CPU display. When I see a CPU alert from xymon I'd like to see the current time interval's CPU stats (The third line of top display - %us, %sy, %ni, etc) rather than the averages of those stats since the last reboot of the machine. This is an old 'complaint' in bugzilla which was closed in 2007 as 'not a bug'. I couldn't find any work-arounds or customizing tips out there to change the display in xymon. What changes can a person make to see the current time interval (any top display other than the first one) statistics for the cpu display in xymon? What about changes in the monitored OS? Any suggestions are appreciated! Thanks.
I think I know what you are asking for, but to be sure can you define what you mean by "current time interval" ?


Thanks!
list Japheth Cleaver
▸
On Tue, July 29, 2014 9:05 am, Schwab, Jos wrote:
Mark,
        Lastly, I also see in the man pages for TOP in the bugs section
(again on CentOS) the TOP author speaks to this very topic. He
calls the intervals samples.  Here is that except:

7. BUGS
       Send bug reports to:
          Albert D. Cahalan, <user-789fe4fc1e68@xymon.invalid>

       The top command calculates Cpu(s) by looking at the change in CPU
time values between  samples.  When
       you  first  run it, it has no previous sample to compare to, so
these initial values are the percent-
       ages since boot. It means you need at least two loops or you have
to ignore summary output  from  the
       first loop.  This is problem for example for batch mode. There is a
possible workaround if you define
       the CPULOOP=1 environment variable. The top command will be run one
extra hidden loop  for  CPU  data
       before standard output.
From: Schwab, Jos
Sent: Tuesday, July 29, 2014 10:56 AM
To: 'Mark Felder'
Cc: 'xymon at xymon.com'
Subject: RE: [Xymon] CPU USAGE DISPLAY (CPU Statistics)


Mark,
        I failed to mention that in the man pages for TOP in CentOS 6.5,
the -d command line option is called the interval which I had read
somewhere is used to average statistics over. I hope that helps
make it more clear and understandable.
Oof: https://bugzilla.redhat.com/show_bug.cgi?id=174619 Well, the system / idle / user etc percentages that end up getting graphed in xymon are actually coming from the vmstat command, being run on rotating 5 minute intervals, so the top output doesn't have an affect on those graphs (or alerting, really). That being said, that's fairly confusing, and it's a bit disappointing that procps doesn't call that out a little bit better in its batch mode. As a quick workaround, you can add CPULOOP=1 to the end of /path/to/xymonclient.cfg and it should be in the environment for the $TOP call in xymonclient-linux.sh. ($TOP gets a -x test against it, so the command itself can't be modified to include env.) That being said, this seems patch-worthy to at least give a more accurate visual output. Wonder how non-Linux `top`'s deal with this... HTH, -jc
list Mark Felder
▸
July 29 2014 6:19 PM, "J.C. Cleaver" wrote:
That being said, this seems patch-worthy to at least give a more accurate
visual output. Wonder how non-Linux `top`'s deal with this...
FreeBSD: No CPU statistics shown in batch mode. In interactive mode the CPU statistics are blank until the second poll.

OpenBSD: Similar behavior to Linux. Their BUGS section in the man page says this:

BUGS
     As with ps(1), things can change while top is collecting information for
     an update.  The picture it gives is only a close approximation to
     reality.
list Jeremy Laidman
From the "top" man page:
▸
"There is a possible workaround if you define the CPULOOP=1 environment
variable. The top command will be run one extra hidden loop for CPU data
before standard output."
You could define this in the appropriate cfg file on each client.

J
▸
On 30/07/2014 6:25 AM, "Schwab, Jos" <user-2b687a9b0cb4@xymon.invalid> wrote:
 Mark,
        I failed to mention that in the man pages for TOP in CentOS 6.5,
the –d command line option is called the interval which I had read
somewhere is used to average statistics over. I hope that helps make it
more clear and understandable.


Jos Schwab
Office – XXX-XXX-XXXX
Mobile – XXX-XXX-XXXX
*SAP Technical Engineer*
XX East Stephenson Street
Freeport, Il. 61032

*user-2b687a9b0cb4@xymon.invalid <user-2b687a9b0cb4@xymon.invalid>*


*From:* Schwab, Jos
*Sent:* Tuesday, July 29, 2014 10:19 AM
*To:* 'Mark Felder'
*Cc:* xymon at xymon.com
*Subject:* RE: [Xymon] CPU USAGE DISPLAY (CPU Statistics)


        Sorry for the delay mark. I took off a couple of days.

        By interval I mean the time span that is used for the calculations
in the cpu stats in the third line of TOP. The first display is calculated
across the time since boot. The second 'interval' is the time calculated
for those same cpu stats since the last iteration of the TOP display which
is...well... it looks like 1 or 2 seconds. Thus that is what I mean by
‘interval’. Interval is whatever is the measured period of time over which
any given TOP display’s cpu statistics are calculated. Xymon shows the
first display of TOP which looks like the first screen shot below. Then
from the same server virtually a few seconds later, I captured a second
display of TOP. Notice the cpu statistics are very different even though
the REAL condition of the server hadn’t changed at all. I would like to
change xymon to display that second iteration of the TOP command.
Let me know if you would like more clarification. Thanks! J
▸
        << OLE Object: Picture (Device Independent Bitmap) >>
 << OLE Object: Picture (Device Independent Bitmap) >>

Jos Schwab
Office – XXX-XXX-XXXX
Mobile – XXX-XXX-XXXX
SAP Technical Engineer
XX East Stephenson Street
Freeport, Il. 61032

user-2b687a9b0cb4@xymon.invalid


-----Original Message-----
From: Mark Felder [mailto:user-db141d317836@xymon.invalid <user-db141d317836@xymon.invalid>]
Sent: Wednesday, July 23, 2014 5:40 PM
To: Schwab, Jos
Cc: xymon at xymon.com
Subject: Re: [Xymon] CPU USAGE DISPLAY (CPU Statistics)


On Jul 23, 2014, at 10:51, Schwab, Jos <user-2b687a9b0cb4@xymon.invalid> wrote:
Hello everyone, I am pretty new to the Linux world. Getting to the point quickly; xymon apparently uses the top display for the CPU display. When I see a CPU alert from xymon I’d like to see the current time interval’s CPU stats (The third line of top display - %us, %sy, %ni, etc) rather than the averages of those stats since the last reboot of the machine. This is an old ‘complaint’ in bugzilla which was closed in 2007 as ‘not a bug’. I couldn’t find any work-arounds or customizing tips out there to change the display in xymon. What changes can a person make to see the current time interval (any top display other than the first one) statistics for the cpu display in xymon? What about changes in the monitored OS? Any suggestions are appreciated! Thanks.I think I know what you are asking for, but to be sure can you define what you mean by "current time interval" ? Thanks!
list Jos Schwab
Hello all,
I apologize for wasting your time. When the environment variable CPULOOP=1 is set properly (with export), the CPULOOP=1 variable setting does have the intended effect of hiding the first top display on my CentOS 6.5 system. I need to get with my co-workers before trying this on either test or prod. Thanks for your assistance and time.
▸
Jos Schwab
Office – XXX-XXX-XXXX
Mobile – XXX-XXX-XXXX
SAP Technical Engineer
XX East Stephenson Street
Freeport, Il. 61032
user-2b687a9b0cb4@xymon.invalid
▸
From: Jeremy Laidman [mailto:user-71895fb2e44c@xymon.invalid]
Sent: Wednesday, August 06, 2014 6:54 AM
To: Schwab, Jos
Cc: xymon at xymon.com; Mark Felder
Subject: Re: [Xymon] CPU USAGE DISPLAY (CPU Statistics)
From the "top" man page:
"There is a possible workaround if you define the CPULOOP=1 environment variable. The top command will be run one extra hidden loop for CPU data before standard output."
You could define this in the appropriate cfg file on each client.
J
On 30/07/2014 6:25 AM, "Schwab, Jos" <user-2b687a9b0cb4@xymon.invalid<mailto:user-2b687a9b0cb4@xymon.invalid>> wrote:
Mark,
I failed to mention that in the man pages for TOP in CentOS 6.5, the –d command line option is called the interval which I had read somewhere is used to average statistics over. I hope that helps make it more clear and understandable.
Jos Schwab
Office – XXX-XXX-XXXX
Mobile – XXX-XXX-XXXX
SAP Technical Engineer
XX East Stephenson Street
Freeport, Il. 61032
user-2b687a9b0cb4@xymon.invalid<mailto:user-2b687a9b0cb4@xymon.invalid>
From: Schwab, Jos
Sent: Tuesday, July 29, 2014 10:19 AM
To: 'Mark Felder'
Cc: xymon at xymon.com<mailto:xymon at xymon.com>
Subject: RE: [Xymon] CPU USAGE DISPLAY (CPU Statistics)
Sorry for the delay mark. I took off a couple of days.
By interval I mean the time span that is used for the calculations in the cpu stats in the third line of TOP. The first display is calculated across the time since boot. The second 'interval' is the time calculated for those same cpu stats since the last iteration of the TOP display which is...well... it looks like 1 or 2 seconds. Thus that is what I mean by ‘interval’. Interval is whatever is the measured period of time over which any given TOP display’s cpu statistics are calculated. Xymon shows the first display of TOP which looks like the first screen shot below. Then from the same server virtually a few seconds later, I captured a second display of TOP. Notice the cpu statistics are very different even though the REAL condition of the server hadn’t changed at all. I would like to change xymon to display that second iteration of the TOP command.
Let me know if you would like more clarification. Thanks! ☺
<< OLE Object: Picture (Device Independent Bitmap) >>
<< OLE Object: Picture (Device Independent Bitmap) >>
Jos Schwab
Office – XXX-XXX-XXXX
Mobile – XXX-XXX-XXXX
SAP Technical Engineer
XX East Stephenson Street
Freeport, Il. 61032
user-2b687a9b0cb4@xymon.invalid<mailto:user-2b687a9b0cb4@xymon.invalid>
-----Original Message-----
From: Mark Felder [mailto:user-db141d317836@xymon.invalid]
Sent: Wednesday, July 23, 2014 5:40 PM
To: Schwab, Jos
Cc: xymon at xymon.com<mailto:xymon at xymon.com>
Subject: Re: [Xymon] CPU USAGE DISPLAY (CPU Statistics)
On Jul 23, 2014, at 10:51, Schwab, Jos <user-2b687a9b0cb4@xymon.invalid<mailto:user-2b687a9b0cb4@xymon.invalid>> wrote:
Hello everyone,
          I am pretty new to the Linux world. Getting to the point
quickly; xymon apparently uses the top display for the CPU display. When I
see a CPU alert from xymon I’d like to see the current time interval’s CPU
stats (The third line of top display - %us, %sy, %ni, etc) rather than the
averages of those stats since the last reboot of the machine. This is an
old ‘complaint’ in bugzilla which was closed in 2007 as ‘not a bug’. I
couldn’t find any work-arounds or customizing tips out there to change the
display in xymon. What changes can a person make to see the current time
interval (any top display other than the first one) statistics for the cpu
display in xymon? What about changes in the monitored OS? Any suggestions
are appreciated! Thanks.
I think I know what you are asking for, but to be sure can you define what
you mean by "current time interval" ?


Thanks!
list Jeremy Laidman
▸
On 07/08/2014 4:26 AM, "Schwab, Jos" <user-2b687a9b0cb4@xymon.invalid> wrote:
When the environment variable CPULOOP=1 is set properly (with export), the CPULOOP=1 variable setting does have the intended effect of hiding the first top display on my CentOS 6.5 system.
So top doesn't match the behavior described in man page, or the version you have doesn't support the feature? Are you trying this from the command line or from the Xymon client config? Does this work: CPULOOP=1 top -b -n 1 On the only system available to me right now (old-ish Debian) top doesn't seem to support this. Instead: $ top -b -n2 | sed '1,/^top/d' You could try adding this into your xymonclient-linux.sh script on your client host. Note that this will make each run take 5 seconds longer. Probably not a problem though. J
list Jos Schwab
I am saying that it looks like with CPULOOP=1set properly that cpu stats are averaged across a very short time; more in ‘realtime’, the way I’d like. So all is good. Thank you all for your help.
▸
Jos Schwab
Office – XXX-XXX-XXXX
Mobile – XXX-XXX-XXXX
SAP Technical Engineer
XX East Stephenson Street
Freeport, Il. 61032

user-2b687a9b0cb4@xymon.invalid
▸
From: Jeremy Laidman [mailto:user-71895fb2e44c@xymon.invalid]
Sent: Wednesday, August 06, 2014 4:09 PM
To: Schwab, Jos
Cc: xymon at xymon.com; Mark Felder
Subject: RE: [Xymon] CPU USAGE DISPLAY (CPU Statistics)
On 07/08/2014 4:26 AM, "Schwab, Jos" <user-2b687a9b0cb4@xymon.invalid<mailto:user-2b687a9b0cb4@xymon.invalid>> wrote:
When the environment variable CPULOOP=1 is set properly (with export),
the CPULOOP=1 variable setting does have the intended effect of hiding the
first top display on my CentOS 6.5 system.
So top doesn't match the behavior described in man page, or the version you
have doesn't support the feature?

Are you trying this from the command line or from the Xymon client config?

Does this work:

CPULOOP=1 top -b -n 1

On the only system available to me right now (old-ish Debian) top doesn't
seem to support this.  Instead:

$ top -b -n2 | sed '1,/^top/d'

You could try adding this into your xymonclient-linux.sh script on your
client host.

Note that this will make each run take 5 seconds longer. Probably not a
problem though.

J