Monitoring iostat performance
list Benjamin Smith
Recently, we had a publicly visible outtage as a result of one of our load balancers exceeding the IOPS capability of its system drives. We'd like to extend xymon (currently installed on CentOS6 /32 with defaults) so that it can monitor IOPS for all servers.

Specifically, we'd like to see wrqm/s and probably %util. What's the most straightforward way to accomplish this? The other alternative is to create some form of internal script, which is doable but not preferable if there's an off-the-shelf tool available.

-Ben
list Japheth Cleaver
▸
On Wed, January 29, 2014 2:55 pm, Lists wrote:
Recently, we had a publicly visible outtage as a result of one of our
load balancers exceeding the IOPS capability of its system drives. We'd
like to extend xymon (currently installed on CentOS6 /32 with defaults)
so that it can monitor IOPS for all servers.

Specifically, we'd like to see wrqm/s and probably %util. What's the
most straightforward way to accomplish this? The other alternative is to
create some form of internal script, which is doable but not preferable
if there's an off-the-shelf tool available.
Not specifically "off-the-shelf", but it's not too difficult to script it
up. We do it in a three-step process due to load, but it could be done
more simply with custom script on the servers themselves that combine #1
and #2 together and send trends messages back to xymond directly.
1) Add iostat/iostatx into xymonclient-linux.sh via the /local/ directory.
We have the following two scripts in place:
[localhost:~xymon/local/]$ head iostat*
==> iostat <==
#!/bin/sh
# iostat is in the sysstat package
echo "iostat -N 300 2 1>$XYMONTMP/xymon_iostat.$MACHINEDOTS.$$ 2>&1; mv
$XYMONTMP/xymon_iostat.$MACHINEDOTS.$$ $XYMONTMP/xymon_iostat.$MACHINEDOTS
2>&1" | nohup sh >/dev/null &
if test -f $XYMONTMP/xymon_iostat.$MACHINEDOTS; then cat
$XYMONTMP/xymon_iostat.$MACHINEDOTS; rm -f
$XYMONTMP/xymon_iostat.$MACHINEDOTS; fi
==> iostatx <==
#!/bin/sh
# iostat is in the sysstat package
echo "iostat -Nx 300 2 1>$XYMONTMP/xymon_iostatx.$MACHINEDOTS.$$ 2>&1; mv
$XYMONTMP/xymon_iostatx.$MACHINEDOTS.$$
$XYMONTMP/xymon_iostatx.$MACHINEDOTS 2>&1" | nohup sh >/dev/null &
if test -f $XYMONTMP/xymon_iostatx.$MACHINEDOTS; then cat
$XYMONTMP/xymon_iostatx.$MACHINEDOTS; rm -f
$XYMONTMP/xymon_iostatx.$MACHINEDOTS; fi
That looks scary, but it basically what the vmstat lines in the built-in
code are doing (although we alter it so the output of 'ps' looks cleaner).
This results in sections labelled "[iostat]" and "[iostatx]" (well,
'[local:iostat]') in the client data stream for the server.
2) We have a separate script that listens on the "client" channel via
xymond_channel and looks for linux systems with the above section in them
(which is the raw output of the iostat command(s)). It munges those into a
"trends" data message like this:
data <hostname>.trends
[iostatx.sda.rrd]
DS:reads:GAUGE:600:0:U 1036.10
DS:writes:GAUGE:600:0:U 534.77
DS:util:GAUGE:600:0:U 100.00
[iostatx.rootvg-rootlv.rrd]
DS:reads:GAUGE:600:0:U 0.00
DS:writes:GAUGE:600:0:U 3.31
DS:util:GAUGE:600:0:U 0.01
[iostatx.rootvg-swaplv.rrd]
DS:reads:GAUGE:600:0:U 0.00
DS:writes:GAUGE:600:0:U 0.00
DS:util:GAUGE:600:0:U 0.00
[iostatx.rootvg-glidelv.rrd]
DS:reads:GAUGE:600:0:U 1036.10
DS:writes:GAUGE:600:0:U 534.26
DS:util:GAUGE:600:0:U 100.00
3) xymond_rrd does what it needs to do to turn these into RRD files, and
we have config files in /graphs.d/ to print them nicely:
[iostatx]
FNPATTERN ^iostatx.(.*).rrd
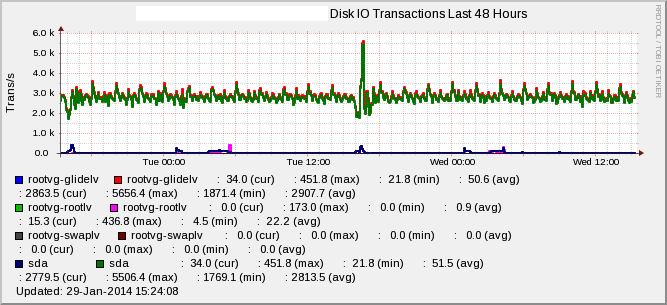
TITLE Disk IO Transactions
YAXIS Trans/s
DEF:r at RRDIDX@=@RRDFN@:reads:AVERAGE
DEF:w at RRDIDX@=@RRDFN@:writes:AVERAGE
LINE2:r at RRDIDX@#@COLOR@:@RRDPARAM@
LINE2:w at RRDIDX@#@COLOR@:@RRDPARAM@
GPRINT:r at RRDIDX@:LAST: \: %5.1lf (cur)
GPRINT:r at RRDIDX@:MAX: \: %5.1lf (max)
GPRINT:r at RRDIDX@:MIN: \: %5.1lf (min)
GPRINT:r at RRDIDX@:AVERAGE: \: %5.1lf (avg)\n
GPRINT:w at RRDIDX@:LAST: \: %5.1lf (cur)
GPRINT:w at RRDIDX@:MAX: \: %5.1lf (max)
GPRINT:w at RRDIDX@:MIN: \: %5.1lf (min)
GPRINT:w at RRDIDX@:AVERAGE: \: %5.1lf (avg)\n
[iostatusage]
FNPATTERN ^iostatx.(.*).rrd
TITLE Disk IO Utilization
YAXIS % Utilization
DEF:u at RRDIDX@=@RRDFN@:util:AVERAGE
LINE2:u at RRDIDX@#@COLOR@:@RRDPARAM@
-u 100
-l 0
GPRINT:u at RRDIDX@:LAST: \: %5.1lf (cur)
GPRINT:u at RRDIDX@:MAX: \: %5.1lf (max)
GPRINT:u at RRDIDX@:MIN: \: %5.1lf (min)
GPRINT:u at RRDIDX@:AVERAGE: \: %5.1lf (avg)\n
4) xymond_rrd can alert directly out of these using the 'DS' option in
analysis.cfg files to override an existing test (we use 'disk', since it
seems to make the most sense).
That's basically it.... The results look like the graphs attached. Hope
this helps!
-jc
Attachments (2)
 attachment.png
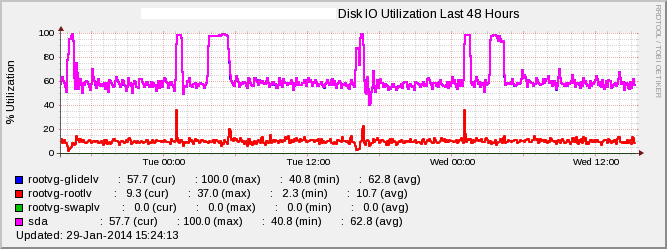 attachment-0001.png
list Jeremy Laidman
▸
On 30 January 2014 09:55, Lists <user-bd60c1f964ce@xymon.invalid> wrote:
Recently, we had a publicly visible outtage as a result of one of our load
balancers exceeding the IOPS capability of its system drives.
Ouch!
▸
We'd like to extend xymon (currently installed on CentOS6 /32 with
defaults) so that it can monitor IOPS for all servers.
I like this idea.  I looked into this quite a while ago, but really only
scratched the surface.
▸
Specifically, we'd like to see wrqm/s and probably %util. What's the most
straightforward way to accomplish this? The other alternative is to create
some form of internal script, which is doable but not preferable if there's
an off-the-shelf tool available.
Whether an add-on or a new Xymon feature, this would almost certainly
require a new section in the client data.  There's already an [iostatdisk]
section used by Solaris and an [iostat] section used by "larrd", although
the format for the latter is a bit funky.  So you could replicate either of
these for Linux by adding this into xymonclient-linux.sh:

nohup sh -c "iostat -x 300 2 1>$XYMONTMP/xymon_iostatdisk.$MACHINEDOTS.$$
2>&1; mv $XYMONTMP/xymon_iostatdisk.$MACHINEDOTS.$$
$XYMONTMP/xymon_iostatdisk.$MACHINEDOTS" </dev/null >/dev/null 2>&1 &
if test -f $XYMONTMP/xymon_iostatdisk.$MACHINEDOTS; then echo
"[iostatdisk]"; cat $XYMONTMP/xymon_iostatdisk.$MACHINEDOTS; rm -f
$XYMONTMP/xymon_iostatdisk.$MACHINEDOTS; fi

We might want "-kx" rather than "-x" depending on potential uses.  But
doesn't matter for %util and wrqm/s.  Adding "-N" (for translating device
names to LVM mappings) might also be useful.

The Xymon parsing code has support only for Solaris.  That means it isn't
readily extensible.  For other client data sections, the parsing code
typically has a case statement that selects the OS and then parses
according to that.  Not the case for iostatdisk or iostat.

In fact, the function that does the parsing - do_iostatdisk_rrd() - is
never called anywhere.  So there's a fair bit of work required within Xymon
to get it to work.  I'd suggest we get the client side going, then writing
a server-side ext script to emulate the parsing code (feeding into a trends
message for RRD), and then start work on core support for iostatdisk within
xymond.

It's probably a bit more complicated than that.  Henrik may have a vision
for universal support of I/O statistics which may be incompatible with what
I'm proposing.  Also, we would probably want to maintain compatibility with
the existing [iostat] graph.cfg definition (the only one that uses the
iostat/iostatdisk results), and that means creating RRD files that are
consistent with the DS names and purposes already in use.  Also, we may
find that metrics we want to graph are inconsistent with metrics already
defined for the Solaris case that already exists.  Also, we'd need to
define a new graph to show the numbers you're interested in, because the
[iostat] graph only shows active/wait service times and %busy.  I think
%busy is analogous to %util.

Implementing this kind of thing in such a way that it supports the majority
of OSes, without too much effort, and without significant conflicts, is
quite a challenge.  I suspect that's the reason we don't have anything in
the way of I/O usage in Xymon.  I've often wondered if using "sar" is a
better way to go, because the output is more (but not completely)
consistent across platforms, and so the parsing code would be simpler and
smaller.  Sar is now available on more OSes than ever before, so we're more
likely to see support from hosts we monitor.  Clients would just do a few
standard "sar" commands to create client data sections (eg [sar-d] [sar-b],
or even [sar-A] for all available output) and Xymon would implement a small
handful of standardised "sar" parsers.  Just an idea.

J
list Alan Ford
Hi Ben,
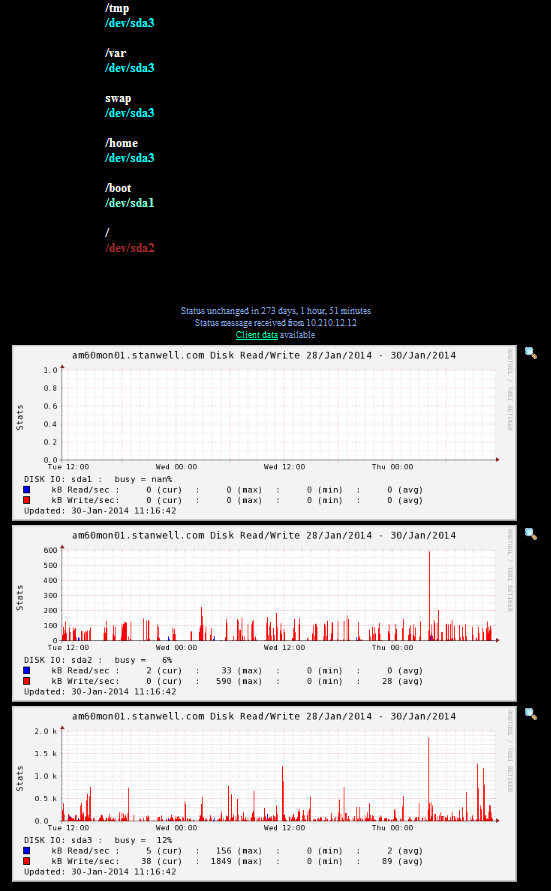
I have written a client program to capture the iostat details so that a backend process can display it.
I do it this way as I have custom client scripts for RHEL and solaris 9 and the use the same backend :-)
My client perl script works for RHEL 4, 5 and 6.
Add this section to clientlaunch.cfg on your client.
[fsio]
ENVFILE $XYMONCLIENTHOME/etc/xymonclient.cfg
CMD $XYMONCLIENTHOME/ext/xy-fsio_rhel.pl
LOGFILE $XYMONCLIENTHOME/logs/xymonclient.log
INTERVAL 5m
On you Xymon server:
Add this section to tasks.cfg
# "rrddata" updates RRD files with information that arrives as "data" messages.
[rrddata]
ENVFILE /home/xymon/xymon/server/etc/xymonserver.cfg
NEEDS xymond
CMD xymond_channel --channel=data --log=$XYMONSERVERLOGS/rrd-data.log xymond_rrd --rrddir=$XYMONVAR/rrd \
--extra-script=/home/xymon/server/ext/process_fsio.pl \
--extra-tests=fsio
Add this to graphs.cfg
[fsio]
FNPATTERN ^fsio,(.*).rrd
TITLE Disk Read/Write
YAXIS Stats
DEF:pb at RRDIDX@=@RRDFN@:pbusy:AVERAGE
DEF:kr at RRDIDX@=@RRDFN@:kread_sec:AVERAGE
DEF:kw at RRDIDX@=@RRDFN@:kwrite_sec:AVERAGE
CDEF:pbn at RRDIDX@=pb at RRDIDX@,5,GT,pb at RRDIDX@,UNKN,IF
COMMENT:DISK IO\: @RRDPARAM@ \:
GPRINT:pbn at RRDIDX@:LAST:busy = %3.0lf%%\n
AREA:kr at RRDIDX@#@COLOR@:
GPRINT:kr at RRDIDX@:LAST:kB Read/sec \: %5.0lf (cur)
GPRINT:kr at RRDIDX@:MAX:\: %5.0lf (max)
GPRINT:kr at RRDIDX@:MIN:\: %5.0lf (min)
GPRINT:kr at RRDIDX@:AVERAGE:\: %5.0lf (avg)\n
AREA:kw at RRDIDX@#@COLOR@:
GPRINT:kw at RRDIDX@:LAST:kB Write/sec\: %5.0lf (cur)
GPRINT:kw at RRDIDX@:MAX:\: %5.0lf (max)
GPRINT:kw at RRDIDX@:MIN:\: %5.0lf (min)
GPRINT:kw at RRDIDX@:AVERAGE:\: %5.0lf (avg)\n
[fsio2]
FNPATTERN ^fsio,(.*).rrd
TITLE I/O Utilization
YAXIS Stats
DEF:p at RRDIDX@B=@RRDFN@:pbusy:AVERAGE
DEF:p at RRDIDX@A=@RRDFN@:asvc_t:AVERAGE
DEF:p at RRDIDX@W=@RRDFN@:wsvc_t:AVERAGE
CDEF:p at RRDIDX@t=p at RRDIDX@B,5,GT,p at RRDIDX@B,UNKN,IF
COMMENT:DISK IO\: @RRDPARAM@ \:
GPRINT:p at RRDIDX@t:LAST:busy = %3.0lf%%\n
AREA:p at RRDIDX@A#@COLOR@:
GPRINT:p at RRDIDX@A:LAST:asvc_t \: %5.1lf (cur)
GPRINT:p at RRDIDX@A:MAX: \: %5.1lf (max)
GPRINT:p at RRDIDX@A:MIN: \: %5.1lf (min)
GPRINT:p at RRDIDX@A:AVERAGE: \: %5.1lf (avg)\n
LINE1:p at RRDIDX@W#@COLOR@:
GPRINT:p at RRDIDX@W:LAST:wsvc_t \: %5.1lf (cur)
GPRINT:p at RRDIDX@W:MAX: \: %5.1lf (max)
GPRINT:p at RRDIDX@W:MIN: \: %5.1lf (min)
GPRINT:p at RRDIDX@W:AVERAGE: \: %5.1lf (avg)\n
Add these in your xymonserver.cfg
TEST2RRD="fsio,fsio2"
GRAPHS="fsio::1,fsio::2"
And away you go :-)
Alan Ford
Senior Database Administrator
Com Serv - Information Communications and Technology
Stanwell Corporation Limited
www.stanwell.com
▸
-----Original Message-----
From: Xymon [mailto:xymon-bounces at xymon.com] On Behalf Of Lists
Sent: Thursday, 30 January 2014 8:56 AM
To: xymon at xymon.com
Subject: [Xymon] Monitoring iostat performance

Recently, we had a publicly visible outtage as a result of one of our load balancers exceeding the IOPS capability of its system drives. We'd like to extend xymon (currently installed on CentOS6 /32 with defaults) so that it can monitor IOPS for all servers.

Specifically, we'd like to see wrqm/s and probably %util. What's the most straightforward way to accomplish this? The other alternative is to create some form of internal script, which is doable but not preferable if there's an off-the-shelf tool available.

-Ben
This email is to be read subject to the email disclaimer located at http://www.stanwell.com/email-disclaimer.aspx
Attachments (1)
 attachment.png
list Vernon Everett
I put his together sometime back.
It's not perfect, but it gives a reasonable indication of what's happening.
Might be a good place to start, or at very least give you some ideas.
https://wiki.xymonton.org/doku.php/monitors:diskstat.ksh
It's Solaris specific, but there is one for Linux, written by Wim Nelis, in
perl.
https://wiki.xymonton.org/doku.php/monitors:diskstat.pl
▸
On 30 January 2014 08:55, Jeremy Laidman <user-71895fb2e44c@xymon.invalid> wrote:
On 30 January 2014 09:55, Lists <user-bd60c1f964ce@xymon.invalid> wrote:Recently, we had a publicly visible outtage as a result of one of our load balancers exceeding the IOPS capability of its system drives.Ouch!We'd like to extend xymon (currently installed on CentOS6 /32 with defaults) so that it can monitor IOPS for all servers.I like this idea. I looked into this quite a while ago, but really only scratched the surface.Specifically, we'd like to see wrqm/s and probably %util. What's the most straightforward way to accomplish this? The other alternative is to create some form of internal script, which is doable but not preferable if there's an off-the-shelf tool available.Whether an add-on or a new Xymon feature, this would almost certainly require a new section in the client data. There's already an [iostatdisk] section used by Solaris and an [iostat] section used by "larrd", although the format for the latter is a bit funky. So you could replicate either of these for Linux by adding this into xymonclient-linux.sh: nohup sh -c "iostat -x 300 2 1>$XYMONTMP/xymon_iostatdisk.$MACHINEDOTS.$$ 2>&1; mv $XYMONTMP/xymon_iostatdisk.$MACHINEDOTS.$$ $XYMONTMP/xymon_iostatdisk.$MACHINEDOTS" </dev/null >/dev/null 2>&1 & if test -f $XYMONTMP/xymon_iostatdisk.$MACHINEDOTS; then echo "[iostatdisk]"; cat $XYMONTMP/xymon_iostatdisk.$MACHINEDOTS; rm -f $XYMONTMP/xymon_iostatdisk.$MACHINEDOTS; fi We might want "-kx" rather than "-x" depending on potential uses. But doesn't matter for %util and wrqm/s. Adding "-N" (for translating device names to LVM mappings) might also be useful. The Xymon parsing code has support only for Solaris. That means it isn't readily extensible. For other client data sections, the parsing code typically has a case statement that selects the OS and then parses according to that. Not the case for iostatdisk or iostat. In fact, the function that does the parsing - do_iostatdisk_rrd() - is never called anywhere. So there's a fair bit of work required within Xymon to get it to work. I'd suggest we get the client side going, then writing a server-side ext script to emulate the parsing code (feeding into a trends message for RRD), and then start work on core support for iostatdisk within xymond. It's probably a bit more complicated than that. Henrik may have a vision for universal support of I/O statistics which may be incompatible with what I'm proposing. Also, we would probably want to maintain compatibility with the existing [iostat] graph.cfg definition (the only one that uses the iostat/iostatdisk results), and that means creating RRD files that are consistent with the DS names and purposes already in use. Also, we may find that metrics we want to graph are inconsistent with metrics already defined for the Solaris case that already exists. Also, we'd need to define a new graph to show the numbers you're interested in, because the [iostat] graph only shows active/wait service times and %busy. I think %busy is analogous to %util. Implementing this kind of thing in such a way that it supports the majority of OSes, without too much effort, and without significant conflicts, is quite a challenge. I suspect that's the reason we don't have anything in the way of I/O usage in Xymon. I've often wondered if using "sar" is a better way to go, because the output is more (but not completely) consistent across platforms, and so the parsing code would be simpler and smaller. Sar is now available on more OSes than ever before, so we're more likely to see support from hosts we monitor. Clients would just do a few standard "sar" commands to create client data sections (eg [sar-d] [sar-b], or even [sar-A] for all available output) and Xymon would implement a small handful of standardised "sar" parsers. Just an idea. J
--
"Accept the challenges so that you can feel the exhilaration of victory"
- General George Patton
list Robert Schetterer
Am 30.01.2014 05:48, schrieb Vernon Everett:
▸
I put his together sometime back.
It's not perfect, but it gives a reasonable indication of what's happening.
Might be a good place to start, or at very least give you some ideas.
https://wiki.xymonton.org/doku.php/monitors:diskstat.ksh
It's Solaris specific, but there is one for Linux, written by Wim Nelis,
in perl.
https://wiki.xymonton.org/doku.php/monitors:diskstat.pl
just tried

http://www.docum.org/drupal/content/linux-iotstat-graphs


Best Regards
MfG Robert Schetterer

--
[*] sys4 AG

http://sys4.de, +49 (89) 30 90 46 64
Franziskanerstraße 15, 81669 München

Sitz der Gesellschaft: München, Amtsgericht München: HRB 199263
Vorstand: Patrick Ben Koetter, Marc Schiffbauer
Aufsichtsratsvorsitzender: Florian Kirstein
list Benjamin Smith
Thanks to everyone for your feedback!

Figured I'd give this a shot, but I can't seem to diagnose what's going
on. There's no apparent change in our xymon install. We're running 4.3.7.

I've verified that both pl scripts are in the $xymonhome/server/ext/
directory on the server and $xymonhome/client/ext/ perl is installed,
and the scripts are chown $xymonuser and chmod u+x.

I've edited the scripts to use our company name instead of stanwell. (do
you have an errant graph?)

I'm assuming this would create an additional column on the overview
page, or maybe an additional graph under trends.... See comments
interspersed below, to document the process I went through for any other
parties. (I'm using CentOS 6.5, all updates applied


-Ben
▸
On 01/29/2014 05:36 PM, Ford, Alan wrote:Hi Ben,
I have written a client program to capture the iostat details so that a backend process can display it.
I do it this way as I have custom client scripts for RHEL and solaris 9 and the use the same backend :-)
My client perl script works for RHEL 4, 5 and 6.
Add this section to clientlaunch.cfg on your client.
[fsio]
ENVFILE $XYMONCLIENTHOME/etc/xymonclient.cfg
CMD $XYMONCLIENTHOME/ext/xy-fsio_rhel.pl
LOGFILE $XYMONCLIENTHOME/logs/xymonclient.log
INTERVAL 5m
Also,
     a) cat xy-fsio_rhel.pl | sed -e s/stanwell.com/mycompany.com/g >
$XYMONCLIENTHOME/client/ext/xy-fsio_rhel.pl
     b) dos2unix $XYMONCLIENTHOME/client/ext/xy-fsio_rhel.pl
     c) chown xymonclient.xymonclient $XYMONCLIENTHOME/client/ext/*
     d) chmod u+x $XYMONCLIENTHOME/client/ext/*
     e) /etc/sudoers:

xymonclient   ALL=NOPASSWD:/usr/sbin/lvdisplay
xymonclient   ALL=NOPASSWD:/sbin/partx

     f) edit xy-fsio_rhel.pl set these variable definitions:

$LVDISPLAY = "$SUDO /usr/sbin/lvdisplay -m 2>/dev/null";
$PARTX = "$SUDO /sbin/partx";
▸
On you Xymon server:
Add this section to tasks.cfg

# "rrddata" updates RRD files with information that arrives as "data" messages.
[rrddata]
	ENVFILE /home/xymon/xymon/server/etc/xymonserver.cfg
	NEEDS xymond
	CMD xymond_channel --channel=data   --log=$XYMONSERVERLOGS/rrd-data.log xymond_rrd --rrddir=$XYMONVAR/rrd  \
             --extra-script=/home/xymon/server/ext/process_fsio.pl \
             --extra-tests=fsio
Note that there is already a section called "rrddata". Basically, add
two lines to that section (don't forget the backslash at the end of the
CMD line!) :
     --extra-script=/home/xymon/server/ext/process_fsio.pl \
     --extra-tests=fsio


Also, install the script:
     a) cat process_fsio.pl | sed -e s/stanwell.com/mycompany.com/g >
$XYMONHOME/server/ext/process_fsio.pl
     b) dos2unix $XYMONHOME/client/ext/process_fsio.pl
     c) chown xymonclient.xymonclient $XYMONHOME/server/ext/*
     d) chmod u+x $XYMONHOME/server/ext/*
▸
Add this to graphs.cfg

[fsio]
       FNPATTERN ^fsio,(.*).rrd
       TITLE Disk Read/Write
       YAXIS Stats
       DEF:pb at RRDIDX@=@RRDFN@:pbusy:AVERAGE
       DEF:kr at RRDIDX@=@RRDFN@:kread_sec:AVERAGE
       DEF:kw at RRDIDX@=@RRDFN@:kwrite_sec:AVERAGE
       CDEF:pbn at RRDIDX@=pb at RRDIDX@,5,GT,pb at RRDIDX@,UNKN,IF
       COMMENT:DISK IO\: @RRDPARAM@ \:
       GPRINT:pbn at RRDIDX@:LAST:busy = %3.0lf%%\n
       AREA:kr at RRDIDX@#@COLOR@:
       GPRINT:kr at RRDIDX@:LAST:kB Read/sec \: %5.0lf (cur)
       GPRINT:kr at RRDIDX@:MAX:\: %5.0lf (max)
       GPRINT:kr at RRDIDX@:MIN:\: %5.0lf (min)
       GPRINT:kr at RRDIDX@:AVERAGE:\: %5.0lf (avg)\n
       AREA:kw at RRDIDX@#@COLOR@:
       GPRINT:kw at RRDIDX@:LAST:kB Write/sec\: %5.0lf (cur)
       GPRINT:kw at RRDIDX@:MAX:\: %5.0lf (max)
       GPRINT:kw at RRDIDX@:MIN:\: %5.0lf (min)
       GPRINT:kw at RRDIDX@:AVERAGE:\: %5.0lf (avg)\n

[fsio2]
       FNPATTERN ^fsio,(.*).rrd
       TITLE I/O Utilization
       YAXIS Stats
       DEF:p at RRDIDX@B=@RRDFN@:pbusy:AVERAGE
       DEF:p at RRDIDX@A=@RRDFN@:asvc_t:AVERAGE
       DEF:p at RRDIDX@W=@RRDFN@:wsvc_t:AVERAGE
       CDEF:p at RRDIDX@t=p at RRDIDX@B,5,GT,p at RRDIDX@B,UNKN,IF
       COMMENT:DISK IO\: @RRDPARAM@ \:
       GPRINT:p at RRDIDX@t:LAST:busy = %3.0lf%%\n
       AREA:p at RRDIDX@A#@COLOR@:
       GPRINT:p at RRDIDX@A:LAST:asvc_t  \: %5.1lf (cur)
       GPRINT:p at RRDIDX@A:MAX: \: %5.1lf (max)
       GPRINT:p at RRDIDX@A:MIN: \: %5.1lf (min)
       GPRINT:p at RRDIDX@A:AVERAGE: \: %5.1lf (avg)\n
       LINE1:p at RRDIDX@W#@COLOR@:
       GPRINT:p at RRDIDX@W:LAST:wsvc_t  \: %5.1lf (cur)
       GPRINT:p at RRDIDX@W:MAX: \: %5.1lf (max)
       GPRINT:p at RRDIDX@W:MIN: \: %5.1lf (min)
       GPRINT:p at RRDIDX@W:AVERAGE: \: %5.1lf (avg)\n
No changes so far...
Add these in your xymonserver.cfg

TEST2RRD="fsio,fsio2"
GRAPHS="fsio::1,fsio::2"


And away you go :-)
*Almost*! I get a graph under "trends" but for some reason the graph
comes up with numbers all being blank or "nan". I'm setting this up on a
nonproduction server, so I've tried generating some disk activity to
make sure it's not a divide by zero error or something.

I wish my perl foo was a bit more up to snuff.