Extra lines for non-existent data
list Jeremy Laidman
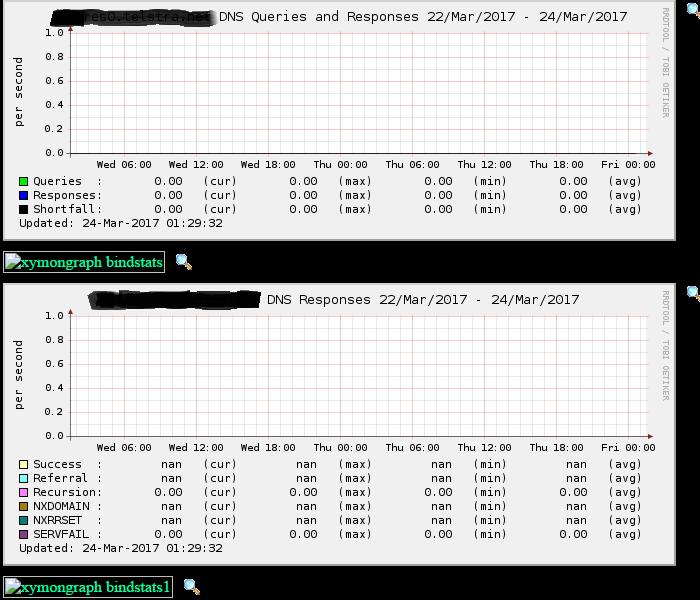
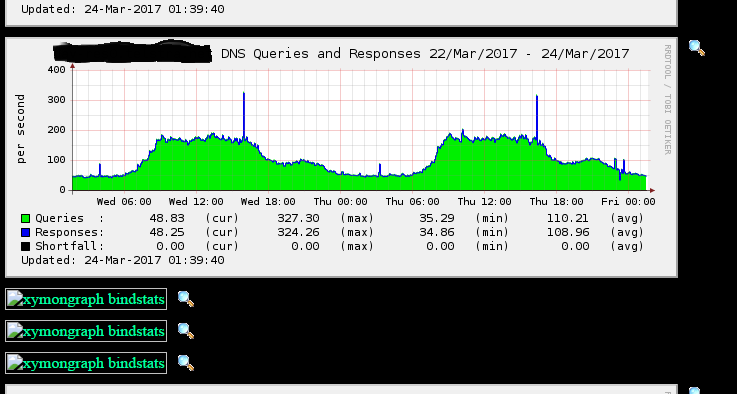
Hi

I'm sure this has been discussed previously, but I don't know if there was
a fix or a work-around.

I have a few graphs that Xymon wants to show over multiple graphs. In the
example below, this is happening for two different graph definitions.The
second of each graph has no data, and so the graphs are broken.

[image: Inline images 1]

In the first of the two graphs (in each case) the URL for the graph image
contains "first=1&count=5". The second, broken, graph image URL contains
"first=6&count=5". Each of these graph definitions, in graphs.cfg, uses one
RRD file per DEF, where each RRD file has only one data series (named
"lambda").

I seem to recall that when xymongen is constructing the URLs for the
images, it has to make a guess about how many to include, based on how many
lines it things there might be, and that guess is not always accurate. Is
there a way to provide hints to xymongen about the number of lines in a
graph? I also seem to recall that Devmon managed to work around this
problem, but I don't know how, or if the same technique can be applied
outside of Devmon.

J
Attachments (1)
 attachment.png
list Jeremy Laidman
▸
On 24 March 2017 at 01:46, Jeremy Laidman <user-71895fb2e44c@xymon.invalid> wrote:
Hi

I'm sure this has been discussed previously, but I don't know if there was
a fix or a work-around.

I have a few graphs that Xymon wants to show over multiple graphs. In the
example below, this is happening for two different graph definitions.The
second of each graph has no data, and so the graphs are broken.
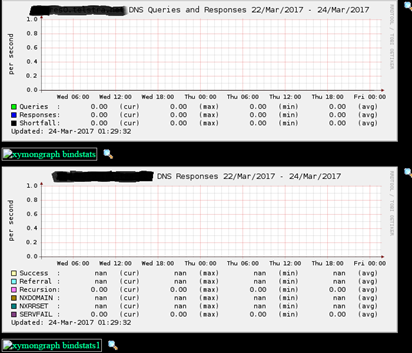
To further complexify this, the same graphs for a different server are
shown 4 times instead of just two - with 3 of the graphs being broken:

[image: Inline images 1]

The URLs contain "first=1&count=4" then "first=5&count=4" etc.

J
Attachments (1)
 attachment.png
list Jeremy Laidman
Thanks Wim

I updated GRAPHS and appended "::1" to my test name as you suggested. But
the trends page still tries to show multiple graphs instead of one.

It's weird how the exact same graph definition attempts to display one too
many graphs for one server, and two too many graphs for another. It's a
mystery how svcstatus.cgi determines how many graphs to show.

I don't know how I could use the "linecount" hack for the trends page. I
should have mentioned that this is where the problem is.

This seems to be a problem that goes back a long time, and hasn't been
implemented in the best way, as suggested by comments in
generate_html_log():

* What we *really* should do was to scan the RRD directory and count how
many
* RRD database files are present matching this service - but that is way too
* much overhead for something that might be called on every status logged.

This makes sense. However, I wonder if the filesystem lookups required for
this would be cached by a modern filesystem, minimising the performance
impact and I/O penalty.

Nevertheless, in absence of reliable heuristics for guessing the number of
graphs required, it would be really valuable to be able to override the
guess in cases where the operator knows the correct answer. If I had
sufficient coding chops, I'd have a crack at adding a feature like this.
Perhaps another modifier like "::=n" to set the number to "n".

J

On 24 March 2017 at 21:24, Nelis, Wim <user-6956df205d63@xymon.invalid> wrote:
Hello Jeremy,


perhaps you can use the “<!—linecount=N -->” line in the status message to
xymon, which states that there are N graphs to be shown. This can be handy
if multiple RRD’s are to be combined in a single graph.

(I’ve patched Devmon to include this linecount-directive in front of the
RRD table. This improves the output of Xymon, but does not solve all
probems.)


And again perhaps, the optional parameter  in the definition of a test in
environmental variable GRAPHS might help. Definition  “test::M” specifies
that at most M RRD’s may be combined into a single graph. What happens if
you set M to one?


Regards,

  Wim Nelis.


*From:* Xymon [mailto:xymon-bounces at xymon.com] *On Behalf Of *Jeremy
Laidman
*Sent:* 23 March 2017 15:46
*To:* xymon at xymon.com
*Subject:* [Xymon] Extra lines for non-existent data
▸
Hi


I'm sure this has been discussed previously, but I don't know if there was
a fix or a work-around.


I have a few graphs that Xymon wants to show over multiple graphs. In the
example below, this is happening for two different graph definitions.The
second of each graph has no data, and so the graphs are broken.


[image: Inline images 1]


In the first of the two graphs (in each case) the URL for the graph image
contains "first=1&count=5". The second, broken, graph image URL contains
"first=6&count=5". Each of these graph definitions, in graphs.cfg, uses one
RRD file per DEF, where each RRD file has only one data series (named
"lambda").


I seem to recall that when xymongen is constructing the URLs for the
images, it has to make a guess about how many to include, based on how many
lines it things there might be, and that guess is not always accurate. Is
there a way to provide hints to xymongen about the number of lines in a
graph? I also seem to recall that Devmon managed to work around this
problem, but I don't know how, or if the same technique can be applied
outside of Devmon.


J
*The NLR disclaimer is valid for NLR e-mail messages.*

This message is only meant for providing information. Nothing in this
e-mail message amounts to a contractual or legal commitment on the part of
the sender.

This message may contain information that is not intended for you. If you
are not the addressee or if this message was sent to you by mistake, you
are requested to inform the sender and delete the message. Sender accepts
no liability for damage of any kind resulting from the risks inherent in
the electronic transmission of messages.
Attachments (1)
 attachment.png
list Jeremy Laidman
▸
On 27 March 2017 at 12:16, Jeremy Laidman <user-71895fb2e44c@xymon.invalid> wrote:
It's weird how the exact same graph definition attempts to display one too
many graphs for one server, and two too many graphs for another. It's a
mystery how svcstatus.cgi determines how many graphs to show.
To answer my own questions, actually, it's fairly simple, and is based on
the number of RRD files matching the testname. The test name that's broken
for me is "bindstats". I have a file called "bindstats.rrd", but I also
have a bunch of other files with names of the form "bindstats,<string>.rrd"
(starting with "bindstats" and followed by a comma and some other text). In
all, there are 14 files matching in this day, for one server, and 11 for
another. It seems that svcstatus.cgi has a maximum of 6 lines per graph, so
for 11 files, it thinks there are two graphs to create (6+5), and for 14
files, it thinks there are three graphs (5+5+4).

I think that my mistake was making different files, for different graphs,
but giving them essentially the same names (with different suffixes
separated by comma). If I rename the graphs to be completely different,
then svcstatus.cgi will only see one file, and won't try to create graphs
for non-existent lines.

J
list Jeremy Laidman
OK, to close this off (in the absence of any way to override the behaviour
of svcstatus.cgi), I made sure that I had exactly one RRD file (everything
up to the first comma in the filename, or the .rrd at the end) to match the
entry in GRAPHS, and all of the broken graphs disappeared. I'm happy now.
▸
On 27 March 2017 at 12:35, Jeremy Laidman <user-71895fb2e44c@xymon.invalid> wrote:
On 27 March 2017 at 12:16, Jeremy Laidman <user-71895fb2e44c@xymon.invalid>
wrote:
It's weird how the exact same graph definition attempts to display one too many graphs for one server, and two too many graphs for another. It's a mystery how svcstatus.cgi determines how many graphs to show.To answer my own questions, actually, it's fairly simple, and is based on the number of RRD files matching the testname. The test name that's broken for me is "bindstats". I have a file called "bindstats.rrd", but I also have a bunch of other files with names of the form "bindstats,<string>.rrd" (starting with "bindstats" and followed by a comma and some other text). In all, there are 14 files matching in this day, for one server, and 11 for another. It seems that svcstatus.cgi has a maximum of 6 lines per graph, so for 11 files, it thinks there are two graphs to create (6+5), and for 14 files, it thinks there are three graphs (5+5+4). I think that my mistake was making different files, for different graphs, but giving them essentially the same names (with different suffixes separated by comma). If I rename the graphs to be completely different, then svcstatus.cgi will only see one file, and won't try to create graphs for non-existent lines. J