graphs that use multiple RRD files as input
list Steve Brown
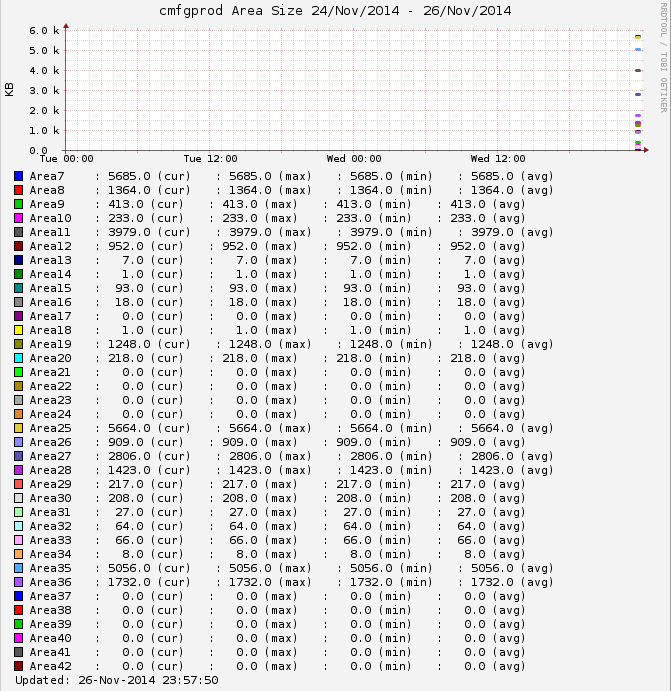
I have a graph setup on a custom test that is using multiple RRD files as input. The graph is working but it is combining all the RRDs into a single graph instead of splitting them up like the built in "disk" graphs.

Is there a parameter missing in my graphs.cfg definition or some other place I need to modify in order to have Xymon automatically split the graph up into multiple graphs?

Thanks
Steve

[DBAreas]
        FNPATTERN DBAreas,(.*).rrd
        TITLE Area Size
        YAXIS KB
        DEF:kba at RRDIDX@=@RRDFN@:kbarea:AVERAGE
        LINE3:kba at RRDIDX@#@COLOR@:Area at RRDPARAM@
        GPRINT:kba at RRDIDX@:LAST: \: %5.1lf (cur)
        GPRINT:kba at RRDIDX@:MAX: \: %5.1lf (max)
        GPRINT:kba at RRDIDX@:MIN: \: %5.1lf (min)
        GPRINT:kba at RRDIDX@:AVERAGE: \: %5.1lf (avg)\n


[cid:image001.png at 01D009CD.379965D0]

Disk splits into more than 1 graph

[cid:image002.png at 01D009CD.C8E83070]
Attachments (2)
 attachment.png
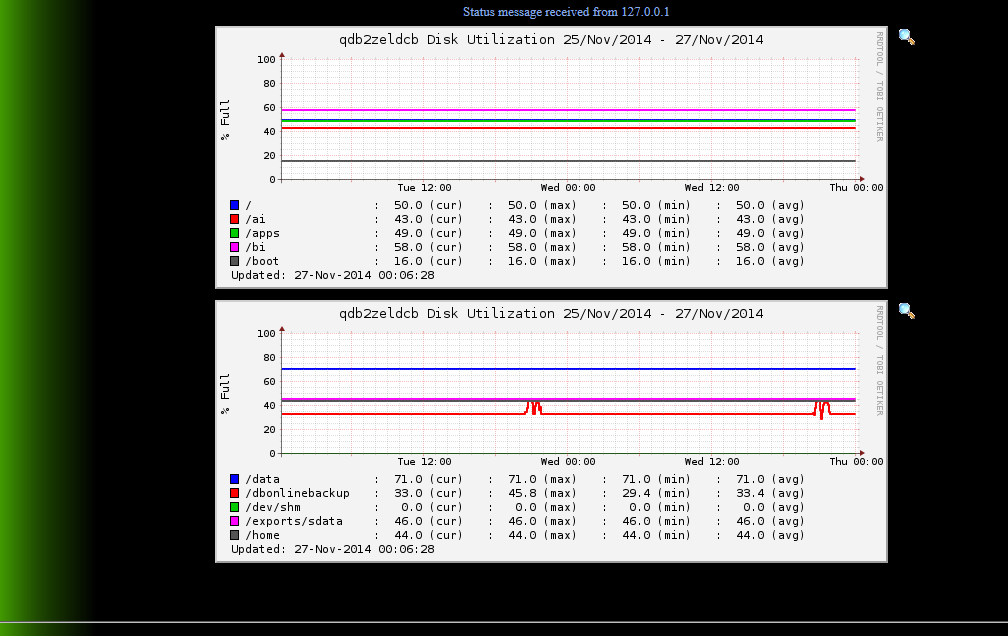 attachment-0001.png
list Steve Brown
I figured this out.

First in cgioptions.cfg I had to add
CGI_SVC_OPTS="...  --multigraphs=,disk,inode,qtree,quotas,snapshot,TblSpace,if_load,DBAreas"
Initially I added just my custom "DBAreas" but that broke the others.  The html.c code says if mulitgraphs is blank then put "disk...if_load" as defaults but if it isn't blank then those don't get loaded so we have to basically add them back.

Adding the mods to cgioptions.cfg worked to a degree. It was graphing the first 4 of my rrds onto one graph but it was only creating the one graph.

To fix that problem I had to add
<!-- linecount=44-->"
Into the message/text that is sent
Like this
INFO=$INFO\n" <!-- linecount=40 -->"
status $MACHINE.$TEST $COLOR $INFO

Steve
▸
From: Steve Brown
Sent: Wednesday, November 26, 2014 11:10 PM
To: xymon at xymon.com
Subject: graphs that use multiple RRD files as input

I have a graph setup on a custom test that is using multiple RRD files as input. The graph is working but it is combining all the RRDs into a single graph instead of splitting them up like the built in "disk" graphs.

Is there a parameter missing in my graphs.cfg definition or some other place I need to modify in order to have Xymon automatically split the graph up into multiple graphs?

Thanks
Steve

[DBAreas]
        FNPATTERN DBAreas,(.*).rrd
        TITLE Area Size
        YAXIS KB
        DEF:kba at RRDIDX@=@RRDFN@:kbarea:AVERAGE
        LINE3:kba at RRDIDX@#@COLOR@:Area at RRDPARAM@
        GPRINT:kba at RRDIDX@:LAST: \: %5.1lf (cur)
        GPRINT:kba at RRDIDX@:MAX: \: %5.1lf (max)
        GPRINT:kba at RRDIDX@:MIN: \: %5.1lf (min)
        GPRINT:kba at RRDIDX@:AVERAGE: \: %5.1lf (avg)\n


Disk splits into more than 1 graph
list Vernon Everett
Hi Steve

Not sure if it's what you are looking for, but check the GRAPHS= in
xymonserver.cfg
If you have a value, let's call it my_test, it will determine the order in
which they will appear on the trends column.
But you can also define the number of data sets (lines) per graph, by
adding ::X after the entry, where X is number of data sets.
Not sure if it works for the primary test display though.

Regards
Vernon
▸
On 28 November 2014 at 04:49, Steve Brown <user-a23886790dfc@xymon.invalid> wrote:
 I figured this out.


First in cgioptions.cfg I had to add

CGI_SVC_OPTS=”…
--multigraphs=,disk,inode,qtree,quotas,snapshot,TblSpace,if_load,DBAreas"

Initially I added just my custom “DBAreas” but that broke the others.  The
html.c code says if mulitgraphs is blank then put “disk…if_load” as
defaults but if it isn’t blank then those don’t get loaded so we have to
basically add them back.


Adding the mods to cgioptions.cfg worked to a degree. It was graphing the
first 4 of my rrds onto one graph but it was only creating the one graph.


To fix that problem I had to add

<!-- linecount=44-->"

Into the message/text that is sent

Like this

INFO=$INFO\n” <!-- linecount=40 -->”

status $MACHINE.$TEST $COLOR $INFO


Steve


*From:* Steve Brown
*Sent:* Wednesday, November 26, 2014 11:10 PM
*To:* xymon at xymon.com
*Subject:* graphs that use multiple RRD files as input


I have a graph setup on a custom test that is using multiple RRD files as
input. The graph is working but it is combining all the RRDs into a single
graph instead of splitting them up like the built in “disk” graphs.


Is there a parameter missing in my graphs.cfg definition or some other
place I need to modify in order to have Xymon automatically split the graph
up into multiple graphs?


Thanks

Steve


[DBAreas]

        FNPATTERN DBAreas,(.*).rrd

        TITLE Area Size

        YAXIS KB

        DEF:kba at RRDIDX@=@RRDFN@:kbarea:AVERAGE

        LINE3:kba at RRDIDX@#@COLOR@:Area at RRDPARAM@

        GPRINT:kba at RRDIDX@:LAST: \: %5.1lf (cur)

        GPRINT:kba at RRDIDX@:MAX: \: %5.1lf (max)

        GPRINT:kba at RRDIDX@:MIN: \: %5.1lf (min)

        GPRINT:kba at RRDIDX@:AVERAGE: \: %5.1lf (avg)\n


Disk splits into more than 1 graph
--
"Accept the challenges so that you can feel the exhilaration of victory"
- General George Patton
list Jeremy Laidman
This is cool.  Is it documented anywhere?


On 28 November 2014 at 18:00, Vernon Everett <user-b3f8dacb72c8@xymon.invalid>
▸
wrote:
Hi Steve

Not sure if it's what you are looking for, but check the GRAPHS= in
xymonserver.cfg
If you have a value, let's call it my_test, it will determine the order in
which they will appear on the trends column.
But you can also define the number of data sets (lines) per graph, by
adding ::X after the entry, where X is number of data sets.
Not sure if it works for the primary test display though.

Regards
Vernon


On 28 November 2014 at 04:49, Steve Brown <user-a23886790dfc@xymon.invalid> wrote:
I figured this out. First in cgioptions.cfg I had to add CGI_SVC_OPTS=”… --multigraphs=,disk,inode,qtree,quotas,snapshot,TblSpace,if_load,DBAreas" Initially I added just my custom “DBAreas” but that broke the others. The html.c code says if mulitgraphs is blank then put “disk…if_load” as defaults but if it isn’t blank then those don’t get loaded so we have to basically add them back. Adding the mods to cgioptions.cfg worked to a degree. It was graphing the first 4 of my rrds onto one graph but it was only creating the one graph. To fix that problem I had to add <!-- linecount=44-->" Into the message/text that is sent Like this INFO=$INFO\n” <!-- linecount=40 -->” status $MACHINE.$TEST $COLOR $INFO Steve *From:* Steve Brown *Sent:* Wednesday, November 26, 2014 11:10 PM *To:* xymon at xymon.com *Subject:* graphs that use multiple RRD files as input I have a graph setup on a custom test that is using multiple RRD files as input. The graph is working but it is combining all the RRDs into a single graph instead of splitting them up like the built in “disk” graphs. Is there a parameter missing in my graphs.cfg definition or some other place I need to modify in order to have Xymon automatically split the graph up into multiple graphs? Thanks Steve [DBAreas] FNPATTERN DBAreas,(.*).rrd TITLE Area Size YAXIS KB DEF:kba at RRDIDX@=@RRDFN@:kbarea:AVERAGE LINE3:kba at RRDIDX@#@COLOR@:Area at RRDPARAM@ GPRINT:kba at RRDIDX@:LAST: \: %5.1lf (cur) GPRINT:kba at RRDIDX@:MAX: \: %5.1lf (max) GPRINT:kba at RRDIDX@:MIN: \: %5.1lf (min) GPRINT:kba at RRDIDX@:AVERAGE: \: %5.1lf (avg)\n Disk splits into more than 1 graph-- "Accept the challenges so that you can feel the exhilaration of victory" - General George Patton
list Vernon Everett
Hi No idea. I can't recall if I read it, or figured it out while playing around with variables to see what they do. Regards Vernon On 1 December 2014 at 09:59, Jeremy Laidman <user-71895fb2e44c@xymon.invalid>
▸
wrote:
This is cool. Is it documented anywhere? On 28 November 2014 at 18:00, Vernon Everett <user-b3f8dacb72c8@xymon.invalid> wrote:Hi Steve Not sure if it's what you are looking for, but check the GRAPHS= in xymonserver.cfg If you have a value, let's call it my_test, it will determine the order in which they will appear on the trends column. But you can also define the number of data sets (lines) per graph, by adding ::X after the entry, where X is number of data sets. Not sure if it works for the primary test display though. Regards Vernon On 28 November 2014 at 04:49, Steve Brown <user-a23886790dfc@xymon.invalid> wrote:I figured this out. First in cgioptions.cfg I had to add CGI_SVC_OPTS=”… --multigraphs=,disk,inode,qtree,quotas,snapshot,TblSpace,if_load,DBAreas" Initially I added just my custom “DBAreas” but that broke the others. The html.c code says if mulitgraphs is blank then put “disk…if_load” as defaults but if it isn’t blank then those don’t get loaded so we have to basically add them back. Adding the mods to cgioptions.cfg worked to a degree. It was graphing the first 4 of my rrds onto one graph but it was only creating the one graph. To fix that problem I had to add <!-- linecount=44-->" Into the message/text that is sent Like this INFO=$INFO\n” <!-- linecount=40 -->” status $MACHINE.$TEST $COLOR $INFO Steve *From:* Steve Brown *Sent:* Wednesday, November 26, 2014 11:10 PM *To:* xymon at xymon.com *Subject:* graphs that use multiple RRD files as input I have a graph setup on a custom test that is using multiple RRD files as input. The graph is working but it is combining all the RRDs into a single graph instead of splitting them up like the built in “disk” graphs. Is there a parameter missing in my graphs.cfg definition or some other place I need to modify in order to have Xymon automatically split the graph up into multiple graphs? Thanks Steve [DBAreas] FNPATTERN DBAreas,(.*).rrd TITLE Area Size YAXIS KB DEF:kba at RRDIDX@=@RRDFN@:kbarea:AVERAGE LINE3:kba at RRDIDX@#@COLOR@:Area at RRDPARAM@ GPRINT:kba at RRDIDX@:LAST: \: %5.1lf (cur) GPRINT:kba at RRDIDX@:MAX: \: %5.1lf (max) GPRINT:kba at RRDIDX@:MIN: \: %5.1lf (min) GPRINT:kba at RRDIDX@:AVERAGE: \: %5.1lf (avg)\n Disk splits into more than 1 graph-- "Accept the challenges so that you can feel the exhilaration of victory" - General George Patton
--
"Accept the challenges so that you can feel the exhilaration of victory"
- General George Patton