RRD data points - need help with graph distortion
list Mike Wood
Hi All,

I asked this question last week, but maybe I wasn't clear enough as to what I was asking...
• Management wants to avoid graph distortion on my 60 day CPU Util graph if possible.  I think that more datapoints would address the problem.
The first graph looks good (30 day graph).  The 2nd one distorts what is really going on (60 day graph - same server).  Is there any way to make the 2nd graph more granular?  Thanks for looking!
• [X]


Mike Wood
UNIX System Administrator
Kinetic Concepts Inc.
5751 NW Parkway
San Antonio, TX, 78249


*****************************************************************************
"CONFIDENTIALITY NOTICE:  This transmission (including any
accompanying attachments) is confidential, is intended only for the
individual or entity named above, and is likely to contain privileged, proprietary and confidential information that is exempt from disclosure requests under applicable law.  If you are not the intended recipient, you are hereby notified that any disclosure, copying, distribution, use of or reliance upon any of the information contained in this transmission
is strictly prohibited.  Any inadvertent or unauthorized disclosure shall not compromise or waive the confidentiality of this transmission or any applicable attorney-client privilege.
If you have received this transmission in error, please immediately notify us at user-c978de0668a4@xymon.invalid."


Kinetic Concepts, Inc.

******************************************************************************
list Mike Wood
Looks like my graphs didn't come through on the E-mail. Trying different attachment type...
▸
From: Wood, Mike [mailto:user-ca9fdeef37c9@xymon.invalid]
Sent: Monday, November 10, 2008 9:06 AM
To: user-ae9b8668bcde@xymon.invalid
Subject: [hobbit] FW: RRD data points - need help with graph distortion
Hi All,
I asked this question last week, but maybe I wasn't clear enough as to what I was asking...
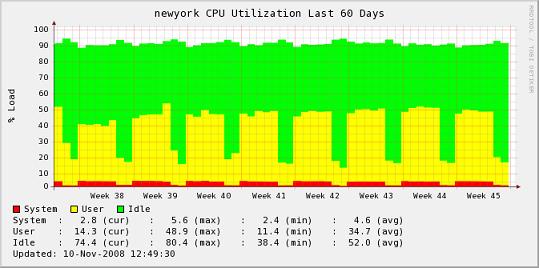
• Management wants to avoid graph distortion on my 60 day CPU Util graph if possible. I think that more datapoints would address the problem.
The first graph looks good (30 day graph). The 2nd one distorts what is really going on (60 day graph - same server). Is there any way to make the 2nd graph more granular? Thanks for looking!
• Mike Wood
UNIX System Administrator
Kinetic Concepts Inc.
5751 NW Parkway
San Antonio, TX, 78249
*****************************************************************************
"CONFIDENTIALITY NOTICE: This transmission (including any
accompanying attachments) is confidential, is intended only for the
individual or entity named above, and is likely to contain privileged, proprietary and confidential information that is exempt from disclosure requests under applicable law. If you are not the intended recipient, you are hereby notified that any disclosure, copying, distribution, use of or reliance upon any of the information contained in this transmission
is strictly prohibited. Any inadvertent or unauthorized disclosure shall not compromise or waive the confidentiality of this transmission or any applicable attorney-client privilege.
If you have received this transmission in error, please immediately notify us at user-c978de0668a4@xymon.invalid."
Kinetic Concepts, Inc.
******************************************************************************
Attachments (2)
 attachment.jpg
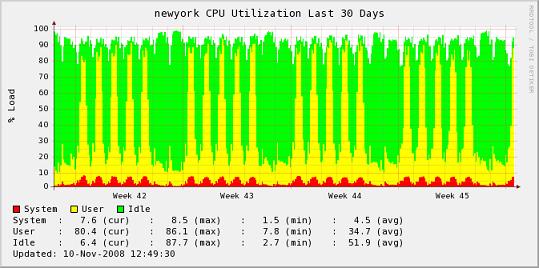 attachment-0001.jpg
list Henrik Størner
▸
In <user-d25e24b63863@xymon.invalid> "Wood, Mike" <user-ca9fdeef37c9@xymon.invalid> writes:
I asked this question last week, but maybe I wasn't clear enough as to what=
I was asking...
• Management wants to avoid graph distortion on my 60 day CPU Util graph if p=
ossible.  I think that more datapoints would address the problem.
The first graph looks good (30 day graph).  The 2nd one distorts what is re=
ally going on (60 day graph - same server).  Is there any way to make the 2=
nd graph more granular?  Thanks for looking!
There is, but it means changin the structure of the RRD files that Hobbit creates. And it only works for new files, not existing data. What you need to change is the "RRA" (Round Robin Archive) definition used by Hobbit when it sets up the rrd files. Each RRA contains data that comes from the measurements, but are averaged out over progressively longer intervals. By default there are 4 sets of data: * a 5-minute average with 576 data points. This corresponds almost directly to the individual measurements Hobbit performs, since they are also done at 5 minute intervals. It holds 576*5 minutes = 48 hours of data. * 6 of the 5-minute averages go into the next RRA, so this is a 30-minute average. Still has 576 data points, so that holds 12 days worth of data. * 24 of the 5-minute averages go into the third RRA, making it a 120- minute (2 hour) average. 576 data points = 48 days of data. * 288 of the 5-minute averages go into the fourth RRA, making it a 24-hour average. With 576 data points, it goes back rougly 1.5 years. These are defined in the Hobbit sourcecode hobbitd/do_rrd.c like this: static char rra1[] = "RRA:AVERAGE:0.5:1:576"; static char rra2[] = "RRA:AVERAGE:0.5:6:576"; static char rra3[] = "RRA:AVERAGE:0.5:24:576"; static char rra4[] = "RRA:AVERAGE:0.5:288:576"; You can see the 1, 6, 24 and 288 number of measurements that go into one data point, and each RRA has 576 data points. Since your 30-day graph was OK - a 30-day graph uses data from the third RRA, since that is the most detailed one covering 30 days - then you could extend that one to cover the 60 days you want. 60 days with a 2-hour average requires 720 data points, so if you change the "rra3" definition to static char rra3[] = "RRA:AVERAGE:0.5:24:720"; it should be enough to store the data you need for a 60-day graph at 2-hour resolution. You can of course do more tweaks, adding more data points just means that your rrd files will take up a bit more disk space. After changing this, you must re-compile Hobbit (run "make clean; make; make install"), and restart Hobbit. Also, this only applies to newly created RRD files, so you will have to delete the current RRD files - so you lose your existing data. All of this is for Hobbit 4.2.x. The coming version makes the RRD definitions configurable without having to muck about with the source code. Regards, Henrik
list Stef Coene
▸
On Monday 10 November 2008, Wood, Mike wrote:
Looks like my graphs didn't come through on the E-mail.  Trying different
attachment type...


From: Wood, Mike [mailto:user-ca9fdeef37c9@xymon.invalid]
Sent: Monday, November 10, 2008 9:06 AM
To: user-ae9b8668bcde@xymon.invalid
Subject: [hobbit] FW: RRD data points - need help with graph distortion

Hi All,

I asked this question last week, but maybe I wasn't clear enough as to what
I was asking... -
Management wants to avoid graph distortion on my 60 day CPU Util graph if
possible.  I think that more datapoints would address the problem. The
first graph looks good (30 day graph).  The 2nd one distorts what is really
going on (60 day graph - same server).  Is there any way to make the 2nd
graph more granular?  Thanks for looking! -
I have a perl script to update all the rrd files:

- it uses rrdtool resize <rrd file> GROW to add extra datapoints so the rrd
has 5760 data points / rra (per default it has 756 data points)

- it adds also MAX and MIN rra's, this is more tricky because I export the rrd
to xml, change the xml info and revert back to an rrd file.

Unfortunatly, I can not share this script.  But with
use RRDs ;
use File::Find ();
you can get info about the file and find them ;)


Stef
list Vernon Everett
I also remember seeing an add-on which allowed you to dump your data points into a MySQL database.
This would allow you to maintain max granularity for as long as your disk space held out.
If I recall, there was no modification or recompilation of the code required. (But don't quote me on that)
Search the archive, and see what comes up.

Cheers
    Vernon
▸
-----Original Message-----
From: Stef Coene [mailto:user-dbffe946c0f4@xymon.invalid]
Sent: Tuesday, 11 November 2008 7:15 AM
To: user-ae9b8668bcde@xymon.invalid
Subject: Re: [hobbit] FW: RRD data points - need help with graph distortion

On Monday 10 November 2008, Wood, Mike wrote:
Looks like my graphs didn't come through on the E-mail. Trying different attachment type... From: Wood, Mike [mailto:user-ca9fdeef37c9@xymon.invalid] Sent: Monday, November 10, 2008 9:06 AM To: user-ae9b8668bcde@xymon.invalid Subject: [hobbit] FW: RRD data points - need help with graph distortion Hi All, I asked this question last week, but maybe I wasn't clear enough as to what I was asking... - Management wants to avoid graph distortion on my 60 day CPU Util graph if possible. I think that more datapoints would address the problem. The first graph looks good (30 day graph). The 2nd one distorts what is really going on (60 day graph - same server). Is there any way to make the 2nd graph more granular? Thanks for looking! -
I have a perl script to update all the rrd files:

- it uses rrdtool resize <rrd file> GROW to add extra datapoints so the rrd has 5760 data points / rra (per default it has 756 data points)

- it adds also MAX and MIN rra's, this is more tricky because I export the rrd to xml, change the xml info and revert back to an rrd file.

Unfortunatly, I can not share this script.  But with use RRDs ; use File::Find (); you can get info about the file and find them ;)


Stef
NOTICE: This email and any attachments are confidential.
They may contain legally privileged information or
copyright material. You must not read, copy, use or
disclose them without authorisation. If you are not an
intended recipient, please contact us at once by return
email and then delete both messages and all attachments.
list Mike Wood
Thanks to all who replied.
▸
Mike Wood
UNIX System Administrator
Kinetic Concepts Inc.
5751 NW Parkway
San Antonio, TX, 78249


-----Original Message-----
▸
From: Everett, Vernon [mailto:user-9da1a1882f49@xymon.invalid]
Sent: Monday, November 10, 2008 6:35 PM
To: user-ae9b8668bcde@xymon.invalid
Subject: RE: [hobbit] FW: RRD data points - need help with graph distortion

I also remember seeing an add-on which allowed you to dump your data points into a MySQL database.
This would allow you to maintain max granularity for as long as your disk space held out.
If I recall, there was no modification or recompilation of the code required. (But don't quote me on that)
Search the archive, and see what comes up.

Cheers
    Vernon

-----Original Message-----
From: Stef Coene [mailto:user-dbffe946c0f4@xymon.invalid]
Sent: Tuesday, 11 November 2008 7:15 AM
To: user-ae9b8668bcde@xymon.invalid
Subject: Re: [hobbit] FW: RRD data points - need help with graph distortion

On Monday 10 November 2008, Wood, Mike wrote:
Looks like my graphs didn't come through on the E-mail. Trying different attachment type... From: Wood, Mike [mailto:user-ca9fdeef37c9@xymon.invalid] Sent: Monday, November 10, 2008 9:06 AM To: user-ae9b8668bcde@xymon.invalid Subject: [hobbit] FW: RRD data points - need help with graph distortion Hi All, I asked this question last week, but maybe I wasn't clear enough as to what I was asking... - Management wants to avoid graph distortion on my 60 day CPU Util graph if possible. I think that more datapoints would address the problem. The first graph looks good (30 day graph). The 2nd one distorts what is really going on (60 day graph - same server). Is there any way to make the 2nd graph more granular? Thanks for looking! -
I have a perl script to update all the rrd files:

- it uses rrdtool resize <rrd file> GROW to add extra datapoints so the rrd has 5760 data points / rra (per default it has 756 data points)

- it adds also MAX and MIN rra's, this is more tricky because I export the rrd to xml, change the xml info and revert back to an rrd file.

Unfortunatly, I can not share this script.  But with use RRDs ; use File::Find (); you can get info about the file and find them ;)


Stef


NOTICE: This email and any attachments are confidential.
They may contain legally privileged information or
copyright material. You must not read, copy, use or
disclose them without authorisation. If you are not an
intended recipient, please contact us at once by return
email and then delete both messages and all attachments.


*****************************************************************************
"CONFIDENTIALITY NOTICE:  This transmission (including any
accompanying attachments) is confidential, is intended only for the
individual or entity named above, and is likely to contain privileged,
proprietary and confidential information that is exempt from disclosure
requests under applicable law.  If you are not the intended recipient,
you are hereby notified that any disclosure, copying, distribution, use
of or reliance upon any of the information contained in this transmission
is strictly prohibited.  Any inadvertent or unauthorized disclosure shall
not compromise or waive the confidentiality of this transmission or any
applicable attorney-client privilege.

If you have received this transmission in error, please immediately
notify us at user-c978de0668a4@xymon.invalid."


Kinetic Concepts, Inc.

******************************************************************************
list Mike Wood
Hi All,

I've used rrdtool resize to change the datapoints / rrd to 5760, but now some, but not all of my graphs only go back 7 weeks.  For example, my 60 day, 90 day, and 1 year graphs all only go back 7 weeks, but my 2 year graph goes back to when I installed / configured hobbit originally - June / July of this year.  Any idea what gives?
• BTW - I have modified hobbitgraph.c to force it to show more than the 4 default graphs.

Thanks in advance!
▸
Mike Wood
UNIX System Administrator
Kinetic Concepts Inc.
5751 NW Parkway
San Antonio, TX, 78249


-----Original Message-----
▸
From: Stef Coene [mailto:user-dbffe946c0f4@xymon.invalid]
Sent: Monday, November 10, 2008 4:15 PM
To: user-ae9b8668bcde@xymon.invalid
Subject: Re: [hobbit] FW: RRD data points - need help with graph distortion

On Monday 10 November 2008, Wood, Mike wrote:
Looks like my graphs didn't come through on the E-mail. Trying different attachment type... From: Wood, Mike [mailto:user-ca9fdeef37c9@xymon.invalid] Sent: Monday, November 10, 2008 9:06 AM To: user-ae9b8668bcde@xymon.invalid Subject: [hobbit] FW: RRD data points - need help with graph distortion Hi All, I asked this question last week, but maybe I wasn't clear enough as to what I was asking... - Management wants to avoid graph distortion on my 60 day CPU Util graph if possible. I think that more datapoints would address the problem. The first graph looks good (30 day graph). The 2nd one distorts what is really going on (60 day graph - same server). Is there any way to make the 2nd graph more granular? Thanks for looking! -
I have a perl script to update all the rrd files:

- it uses rrdtool resize <rrd file> GROW to add extra datapoints so the rrd
has 5760 data points / rra (per default it has 756 data points)

- it adds also MAX and MIN rra's, this is more tricky because I export the rrd
to xml, change the xml info and revert back to an rrd file.

Unfortunatly, I can not share this script.  But with
use RRDs ;
use File::Find ();
you can get info about the file and find them ;)


Stef


*****************************************************************************
"CONFIDENTIALITY NOTICE:  This transmission (including any
accompanying attachments) is confidential, is intended only for the
individual or entity named above, and is likely to contain privileged,
proprietary and confidential information that is exempt from disclosure
requests under applicable law.  If you are not the intended recipient,
you are hereby notified that any disclosure, copying, distribution, use
of or reliance upon any of the information contained in this transmission
is strictly prohibited.  Any inadvertent or unauthorized disclosure shall
not compromise or waive the confidentiality of this transmission or any
applicable attorney-client privilege.

If you have received this transmission in error, please immediately
notify us at user-c978de0668a4@xymon.invalid."


Kinetic Concepts, Inc.

******************************************************************************