graph themes
list Kris Springer
Can anyone advise on how to theme the graphs a bit? After 20 years of
the light gray rectangles I'd like them to look a little more modern.

--

Kris Springer
list Jean-Pierre Pitout [ Mtn South Africa ]
Something similar to Grafana would be awesome! It provides a very rich set of graphing options.  (see image below) No idea if RRDs can be used though.

    Reference - http://docs.grafana.org/features/panels/graph/


[http://docs.grafana.org/img/v1/graph_overview.png]


    Jean-Pierre Pitout [ MTN South Africa ]
    Senior Linux Engineer (RHCA)
    IS Client Server Line-Of-Business Linux
    user-ea0bd803d592@xymon.invalid
▸
From: Xymon <xymon-bounces at xymon.com> on behalf of Kris Springer <user-c2caa0a7a8d5@xymon.invalid>
Sent: 27 November 2018 19:24
To: Xymon MailingList
Subject: [Xymon] graph themes

Can anyone advise on how to theme the graphs a bit?  After 20 years of the light gray rectangles I'd like them to look a little more modern.

--

Kris Springer
"This email is confidential. If you have received it in error, you are on notice of its status. Please notify us immediately by reply email and then delete this message from your system. Please do not copy it or use it for any purpose, or disclose its contents to any other person as to do so could be a breach of confidentiality. Thank you for your co-operation. "

"The information contained in this message is intended solely for the individual to whom it is specifically and originally addressed. This message and its contents may contain confidential or privileged information from MTN Group. If you are not the intended recipient, you are hereby notified that any disclosure or distribution, is strictly prohibited. If you receive this email in error, please notify MTN Group immediately and delete it. MTN Group does not accept any liability or responsibility if action is taken in reliance on the contents of this information . Note that all personal emails are not authorized by MTN Group. "
list Jonathan Trott
I’m still hoping one day for HiDPI support in RRD…

Thanks,
JT
▸
From: Xymon <xymon-bounces at xymon.com> On Behalf Of Kris Springer
Sent: Wednesday, 28 November 2018 4:24 AM
To: Subject: [Xymon] graph themes

Can anyone advise on how to theme the graphs a bit?  After 20 years of the light gray rectangles I'd like them to look a little more modern.


--


Kris Springer
list Kris Springer
Ok, let me ask the question a different way.  Is there a config file that rrdtool uses to graph everything that I can edit? Or is the graph design hard coded into xymon as a default theme that can't be changed?

Kris Springer
▸
On 11/27/18 2:02 PM, Jean-Pierre Pitout [ MTN South Africa ] wrote:Something similar to Grafana would be awesome! It provides a very rich set of graphing options. (see image below) No idea if RRDs can be used though. Reference - http://docs.grafana.org/features/panels/graph/ // /________________________________________________ Jean-Pierre Pitout [ MTN South Africa ] Senior Linux Engineer (RHCA) IS Client Server Line-Of-Business Linux user-ea0bd803d592@xymon.invalid / *From:* Xymon <xymon-bounces at xymon.com> on behalf of Kris Springer <user-c2caa0a7a8d5@xymon.invalid> *Sent:* 27 November 2018 19:24 *To:* Xymon MailingList *Subject:* [Xymon] graph themes Can anyone advise on how to theme the graphs a bit? After 20 years of the light gray rectangles I'd like them to look a little more modern. -- Kris Springer *"This email is confidential. If you have received it in error, you are on notice of its status. Please notify us immediately by reply email and then delete this message from your system. Please do not copy it or use it for any purpose, or disclose its contents to any other person as to do so could be a breach of confidentiality. Thank you for your co-operation. "* “The information contained in this message is intended solely for the individual to whom it is specifically and originally addressed. This message and its contents may contain confidential or privileged information from MTN Group. If you are not the intended recipient, you are hereby notified that any disclosure or distribution, is strictly prohibited. If you receive this email in error, please notify MTN Group immediately and delete it. MTN Group does not accept any liability or responsibility if action is taken in reliance on the contents of this information . Note that all personal emails are not authorized by MTN Group. ”
list Kris Springer
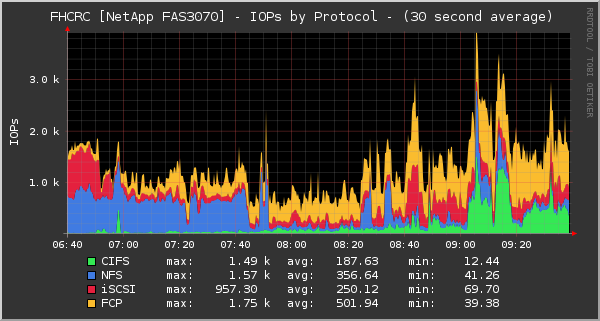
It can be done.
https://oss.oetiker.ch/rrdtool/gallery/

All I need to know is what line in what config file to edit.  I'm guessing it's the xymon/server/etc/graphs.cfg file, but I don't know what exactly to change to make my graphs look like this color scheme.
https://oss.oetiker.ch/rrdtool/gallery/netapp-iops.png
▸
Kris Springer


On 11/27/18 2:02 PM, Jean-Pierre Pitout [ MTN South Africa ] wrote:
Something similar to Grafana would be awesome! It provides a very rich set of graphing options. (see image below) No idea if RRDs can be used though. Reference - http://docs.grafana.org/features/panels/graph/ // /________________________________________________ Jean-Pierre Pitout [ MTN South Africa ] Senior Linux Engineer (RHCA) IS Client Server Line-Of-Business Linux user-ea0bd803d592@xymon.invalid / *From:* Xymon <xymon-bounces at xymon.com> on behalf of Kris Springer <user-c2caa0a7a8d5@xymon.invalid> *Sent:* 27 November 2018 19:24 *To:* Xymon MailingList *Subject:* [Xymon] graph themes Can anyone advise on how to theme the graphs a bit? After 20 years of the light gray rectangles I'd like them to look a little more modern. -- Kris Springer *"This email is confidential. If you have received it in error, you are on notice of its status. Please notify us immediately by reply email and then delete this message from your system. Please do not copy it or use it for any purpose, or disclose its contents to any other person as to do so could be a breach of confidentiality. Thank you for your co-operation. "* “The information contained in this message is intended solely for the individual to whom it is specifically and originally addressed. This message and its contents may contain confidential or privileged information from MTN Group. If you are not the intended recipient, you are hereby notified that any disclosure or distribution, is strictly prohibited. If you receive this email in error, please notify MTN Group immediately and delete it. MTN Group does not accept any liability or responsibility if action is taken in reliance on the contents of this information . Note that all personal emails are not authorized by MTN Group. ”
list Kris Springer
I tried adding the color lines into my graphs.cfg file as specified in this how-to
https://oss.oetiker.ch/rrdtool/doc/rrdgraph.en.html

I edited one section to see what would happen.  It threw an error that said _*invalid color def format*_

Here's the section of my graphs.cfg that I edited.  Anyone know what the correct formatting is so I can stylize my graphs?

[memory]
         FNPATTERN ^memory.(.+).rrd
         TITLE Memory Utilization
         YAXIS % Used
         DEF:p at RRDIDX@=@RRDFN@:realmempct:AVERAGE
         LINE2:p at RRDIDX@#@COLOR@:@RRDPARAM@
         -u 100
         -b 1024
*-c BACK#363636**
**      -c CANVAS#000000**
**      -c SHADEA#CFCFCF**
**      -c SHADEB#CFCFCF**
**      -c GRID#222222**
**      -c MGRID#441E1E**
**      -c FONT#FFFFFF**
**      -c AXIS#696969**
**      -c FRAME#000000**
**      -c ARROW#FA0016*
         GPRINT:p at RRDIDX@:LAST: \: %5.1lf (cur)
         GPRINT:p at RRDIDX@:MAX: \: %5.1lf (max)
         GPRINT:p at RRDIDX@:MIN: \: %5.1lf (min)
         GPRINT:p at RRDIDX@:AVERAGE: \: %5.1lf (avg)\n
▸
Kris Springer


On 11/27/18 2:02 PM, Jean-Pierre Pitout [ MTN South Africa ] wrote:
Something similar to Grafana would be awesome! It provides a very rich set of graphing options. (see image below) No idea if RRDs can be used though. Reference - http://docs.grafana.org/features/panels/graph/ // /________________________________________________ Jean-Pierre Pitout [ MTN South Africa ] Senior Linux Engineer (RHCA) IS Client Server Line-Of-Business Linux user-ea0bd803d592@xymon.invalid / *From:* Xymon <xymon-bounces at xymon.com> on behalf of Kris Springer <user-c2caa0a7a8d5@xymon.invalid> *Sent:* 27 November 2018 19:24 *To:* Xymon MailingList *Subject:* [Xymon] graph themes Can anyone advise on how to theme the graphs a bit? After 20 years of the light gray rectangles I'd like them to look a little more modern. -- Kris Springer *"This email is confidential. If you have received it in error, you are on notice of its status. Please notify us immediately by reply email and then delete this message from your system. Please do not copy it or use it for any purpose, or disclose its contents to any other person as to do so could be a breach of confidentiality. Thank you for your co-operation. "* “The information contained in this message is intended solely for the individual to whom it is specifically and originally addressed. This message and its contents may contain confidential or privileged information from MTN Group. If you are not the intended recipient, you are hereby notified that any disclosure or distribution, is strictly prohibited. If you receive this email in error, please notify MTN Group immediately and delete it. MTN Group does not accept any liability or responsibility if action is taken in reliance on the contents of this information . Note that all personal emails are not authorized by MTN Group. ”
list Ralph Mitchell
There may be a better place to put this, but it works for me.  In:

     /home/xymon/server/etc/xymonserver.cfg

add this as one long line:

RRDGRAPHOPTS="-c BACK#363636 -c CANVAS#000000 -c SHADEA#CFCFCF -c
▸
SHADEB#CFCFCF -c GRID#222222 -c MGRID#441E1E -c FONT#FFFFFF -c AXIS#696969
-c FRAME#000000 -c ARROW#FA0016"
Take them out of the graphs.cfg file.  I don't know if it's strictly
necessary to restart Xymon, but I did, and all the graphs now come up with
those colors.  Not sure how to make it work with individual graphs.

Ralph Mitchell


On Tue, Nov 27, 2018 at 7:33 PM Kris Springer <user-c2caa0a7a8d5@xymon.invalid>
▸
wrote:
I tried adding the color lines into my graphs.cfg file as specified in
this how-to
https://oss.oetiker.ch/rrdtool/doc/rrdgraph.en.html

I edited one section to see what would happen.  It threw an error that
said *invalid color def format*

Here's the section of my graphs.cfg that I edited.  Anyone know what the
correct formatting is so I can stylize my graphs?

[memory]
        FNPATTERN ^memory.(.+).rrd
        TITLE Memory Utilization
        YAXIS % Used
        DEF:p at RRDIDX@=@RRDFN@:realmempct:AVERAGE
        LINE2:p at RRDIDX@#@COLOR@:@RRDPARAM@
        -u 100
        -b 1024
       *-c BACK#363636*
*      -c CANVAS#000000*
*      -c SHADEA#CFCFCF*
*      -c SHADEB#CFCFCF*
*      -c GRID#222222*
*      -c MGRID#441E1E*
*      -c FONT#FFFFFF*
*      -c AXIS#696969*
*      -c FRAME#000000*
*      -c ARROW#FA0016*
        GPRINT:p at RRDIDX@:LAST: \: %5.1lf (cur)
        GPRINT:p at RRDIDX@:MAX: \: %5.1lf (max)
        GPRINT:p at RRDIDX@:MIN: \: %5.1lf (min)
        GPRINT:p at RRDIDX@:AVERAGE: \: %5.1lf (avg)\n


Kris Springer


On 11/27/18 2:02 PM, Jean-Pierre Pitout [ MTN South Africa ] wrote:

Something similar to Grafana would be awesome! It provides a very rich set
of graphing options.  (see image below) No idea if RRDs can be used though.

    Reference - http://docs.grafana.org/features/panels/graph/


*   ________________________________________________     Jean-Pierre
Pitout [ MTN South Africa ]     Senior Linux Engineer (RHCA)     IS Client
Server Line-Of-Business Linux
user-ea0bd803d592@xymon.invalid
<user-ea0bd803d592@xymon.invalid> *

*From:* Xymon <xymon-bounces at xymon.com> <xymon-bounces at xymon.com> on
behalf of Kris Springer <user-c2caa0a7a8d5@xymon.invalid>
<user-c2caa0a7a8d5@xymon.invalid>
*Sent:* 27 November 2018 19:24
*To:* Xymon MailingList
*Subject:* [Xymon] graph themes

Can anyone advise on how to theme the graphs a bit?  After 20 years of the
light gray rectangles I'd like them to look a little more modern.

--

Kris Springer


*"This email is confidential. If you have received it in error, you are on
notice of its status. Please notify us immediately by reply email and then
delete this message from your system. Please do not copy it or use it for
any purpose, or disclose its contents to any other person as to do so could
be a breach of confidentiality. Thank you for your co-operation. "*

“The information contained in this message is intended solely for the
individual to whom it is specifically and originally addressed. This
message and its contents may contain confidential or privileged information
from MTN Group. If you are not the intended recipient, you are hereby
notified that any disclosure or distribution, is strictly prohibited. If
you receive this email in error, please notify MTN Group immediately and
delete it. MTN Group does not accept any liability or responsibility if
action is taken in reliance on the contents of this information . Note that
all personal emails are not authorized by MTN Group. ”
list Kris Springer
Thanks Ralph!  That works perfectly!  And there's no need to restart
anything.  The graphs appeared differently with just a web page refresh.

Kris Springer
▸
On 11/27/18 6:21 PM, Ralph Mitchell wrote:There may be a better place to put this, but it works for me. In: /home/xymon/server/etc/xymonserver.cfg add this as one long line: RRDGRAPHOPTS="-c BACK#363636 -c CANVAS#000000 -c SHADEA#CFCFCF -c SHADEB#CFCFCF -c GRID#222222 -c MGRID#441E1E -c FONT#FFFFFF -c AXIS#696969 -c FRAME#000000 -c ARROW#FA0016" Take them out of the graphs.cfg file. I don't know if it's strictly necessary to restart Xymon, but I did, and all the graphs now come up with those colors. Not sure how to make it work with individual graphs. Ralph Mitchell On Tue, Nov 27, 2018 at 7:33 PM Kris Springer <user-c2caa0a7a8d5@xymon.invalid <mailto:user-c2caa0a7a8d5@xymon.invalid>> wrote: I tried adding the color lines into my graphs.cfg file as specified in this how-to https://oss.oetiker.ch/rrdtool/doc/rrdgraph.en.html I edited one section to see what would happen. It threw an error that said _*invalid color def format*_ Here's the section of my graphs.cfg that I edited. Anyone know what the correct formatting is so I can stylize my graphs? [memory] FNPATTERN ^memory.(.+).rrd TITLE Memory Utilization YAXIS % Used DEF:p at RRDIDX@=@RRDFN@:realmempct:AVERAGE LINE2:p at RRDIDX@#@COLOR@:@RRDPARAM@ -u 100 -b 1024 *-c BACK#363636** ** -c CANVAS#000000** ** -c SHADEA#CFCFCF** ** -c SHADEB#CFCFCF** ** -c GRID#222222** ** -c MGRID#441E1E** ** -c FONT#FFFFFF** ** -c AXIS#696969** ** -c FRAME#000000** ** -c ARROW#FA0016* GPRINT:p at RRDIDX@:LAST: \: %5.1lf (cur) GPRINT:p at RRDIDX@:MAX: \: %5.1lf (max) GPRINT:p at RRDIDX@:MIN: \: %5.1lf (min) GPRINT:p at RRDIDX@:AVERAGE: \: %5.1lf (avg)\n Kris Springer On 11/27/18 2:02 PM, Jean-Pierre Pitout [ MTN South Africa ] wrote:Something similar to Grafana would be awesome! It provides a very rich set of graphing options. (see image below) No idea if RRDs can be used though. Reference - http://docs.grafana.org/features/panels/graph/ // /________________________________________________ Jean-Pierre Pitout [ MTN South Africa ] Senior Linux Engineer (RHCA) IS Client Server Line-Of-Business Linux user-ea0bd803d592@xymon.invalid / *From:* Xymon <xymon-bounces at xymon.com>
    <mailto:xymon-bounces at xymon.com> on behalf of Kris Springer
    <user-c2caa0a7a8d5@xymon.invalid> <mailto:user-c2caa0a7a8d5@xymon.invalid>
▸
    *Sent:* 27 November 2018 19:24
    *To:* Xymon MailingList
    *Subject:* [Xymon] graph themes
    Can anyone advise on how to theme the graphs a bit?  After 20
    years of the light gray rectangles I'd like them to look a little
    more modern.
    --

    Kris Springer


    *"This email is confidential. If you have received it in error,
    you are on notice of its status. Please notify us immediately by
    reply email and then delete this message from your system. Please
    do not copy it or use it for any purpose, or disclose its
    contents to any other person as to do so could be a breach of
    confidentiality. Thank you for your co-operation. "*


    “The information contained in this message is intended solely for
    the individual to whom it is specifically and originally
    addressed. This message and its contents may contain confidential
    or privileged information from MTN Group. If you are not the
    intended recipient, you are hereby notified that any disclosure
    or distribution, is strictly prohibited. If you receive this
    email in error, please notify MTN Group immediately and delete
    it. MTN Group does not accept any liability or responsibility if
    action is taken in reliance on the contents of this information .
    Note that all personal emails are not authorized by MTN Group. ”
list Ralph Mitchell
Excellent!  I may do something like that at work.  Slowly change the colors
over a month or so and see how long it takes anyone to notice...  :)

Ralph Mitchell


On Tue, Nov 27, 2018 at 9:08 PM Kris Springer <user-c2caa0a7a8d5@xymon.invalid>
▸
wrote:
Thanks Ralph!  That works perfectly!  And there's no need to restart
anything.  The graphs appeared differently with just a web page refresh.

Kris Springer


On 11/27/18 6:21 PM, Ralph Mitchell wrote:

There may be a better place to put this, but it works for me.  In:

     /home/xymon/server/etc/xymonserver.cfg

add this as one long line:

RRDGRAPHOPTS="-c BACK#363636 -c CANVAS#000000 -c SHADEA#CFCFCF -c
SHADEB#CFCFCF -c GRID#222222 -c MGRID#441E1E -c FONT#FFFFFF -c AXIS#696969
-c FRAME#000000 -c ARROW#FA0016"

Take them out of the graphs.cfg file.  I don't know if it's strictly
necessary to restart Xymon, but I did, and all the graphs now come up with
those colors.  Not sure how to make it work with individual graphs.

Ralph Mitchell


On Tue, Nov 27, 2018 at 7:33 PM Kris Springer <user-c2caa0a7a8d5@xymon.invalid>
wrote:
I tried adding the color lines into my graphs.cfg file as specified in this how-to https://oss.oetiker.ch/rrdtool/doc/rrdgraph.en.html I edited one section to see what would happen. It threw an error that said *invalid color def format* Here's the section of my graphs.cfg that I edited. Anyone know what the correct formatting is so I can stylize my graphs? [memory] FNPATTERN ^memory.(.+).rrd TITLE Memory Utilization YAXIS % Used DEF:p at RRDIDX@=@RRDFN@:realmempct:AVERAGE LINE2:p at RRDIDX@#@COLOR@:@RRDPARAM@ -u 100 -b 1024 *-c BACK#363636* * -c CANVAS#000000* * -c SHADEA#CFCFCF* * -c SHADEB#CFCFCF* * -c GRID#222222* * -c MGRID#441E1E* * -c FONT#FFFFFF* * -c AXIS#696969* * -c FRAME#000000* * -c ARROW#FA0016* GPRINT:p at RRDIDX@:LAST: \: %5.1lf (cur) GPRINT:p at RRDIDX@:MAX: \: %5.1lf (max) GPRINT:p at RRDIDX@:MIN: \: %5.1lf (min) GPRINT:p at RRDIDX@:AVERAGE: \: %5.1lf (avg)\n Kris Springer On 11/27/18 2:02 PM, Jean-Pierre Pitout [ MTN South Africa ] wrote: Something similar to Grafana would be awesome! It provides a very rich set of graphing options. (see image below) No idea if RRDs can be used though. Reference - http://docs.grafana.org/features/panels/graph/ * ________________________________________________ Jean-Pierre Pitout [ MTN South Africa ] Senior Linux Engineer (RHCA) IS Client Server Line-Of-Business Linux user-ea0bd803d592@xymon.invalid <user-ea0bd803d592@xymon.invalid> * *From:* Xymon <xymon-bounces at xymon.com> <xymon-bounces at xymon.com> on behalf of Kris Springer <user-c2caa0a7a8d5@xymon.invalid> <user-c2caa0a7a8d5@xymon.invalid> *Sent:* 27 November 2018 19:24 *To:* Xymon MailingList *Subject:* [Xymon] graph themes Can anyone advise on how to theme the graphs a bit? After 20 years of the light gray rectangles I'd like them to look a little more modern. -- Kris Springer *"This email is confidential. If you have received it in error, you are on notice of its status. Please notify us immediately by reply email and then delete this message from your system. Please do not copy it or use it for any purpose, or disclose its contents to any other person as to do so could be a breach of confidentiality. Thank you for your co-operation. "* “The information contained in this message is intended solely for the individual to whom it is specifically and originally addressed. This message and its contents may contain confidential or privileged information from MTN Group. If you are not the intended recipient, you are hereby notified that any disclosure or distribution, is strictly prohibited. If you receive this email in error, please notify MTN Group immediately and delete it. MTN Group does not accept any liability or responsibility if action is taken in reliance on the contents of this information . Note that all personal emails are not authorized by MTN Group. ”
list Kris Springer
Just to close the loop on this conversation, here's what I added to my
xymonserver.cfg file to get my graphs the way I wanted.  As previously
stated the opts are all on one long line.

# graph theme
# values can be found at https://oss.oetiker.ch/rrdtool/doc/rrdgraph.en.html
RRDGRAPHOPTS="-E -R light --border 0 --dynamic-labels -a PNG --grid-dash
1:0 -n LEGEND:8:Roboto -n TITLE:9:Roboto -n AXIS:7:Roboto -n
UNIT:7:Roboto -n WATERMARK:.1:Roboto -c BACK#262626 -c CANVAS#000000 -c
SHADEA#000000 -c SHADEB#000000 -c GRID#00000000 -c MGRID#DDDDDD11 -c
FONT#DDDDDD -c AXIS#262626 -c FRAME#000000 -c ARROW#262626"

I'd still like rounded corners and I haven't figured out how to change
the graph line colors, but that's not a big deal for me at this moment.
▸
Kris Springer


On 11/27/18 6:21 PM, Ralph Mitchell wrote:
There may be a better place to put this, but it works for me. In: /home/xymon/server/etc/xymonserver.cfg add this as one long line: RRDGRAPHOPTS="-c BACK#363636 -c CANVAS#000000 -c SHADEA#CFCFCF -c SHADEB#CFCFCF -c GRID#222222 -c MGRID#441E1E -c FONT#FFFFFF -c AXIS#696969 -c FRAME#000000 -c ARROW#FA0016" Take them out of the graphs.cfg file. I don't know if it's strictly necessary to restart Xymon, but I did, and all the graphs now come up with those colors. Not sure how to make it work with individual graphs. Ralph Mitchell On Tue, Nov 27, 2018 at 7:33 PM Kris Springer <user-c2caa0a7a8d5@xymon.invalid <mailto:user-c2caa0a7a8d5@xymon.invalid>> wrote: I tried adding the color lines into my graphs.cfg file as specified in this how-to https://oss.oetiker.ch/rrdtool/doc/rrdgraph.en.html I edited one section to see what would happen. It threw an error that said _*invalid color def format*_ Here's the section of my graphs.cfg that I edited. Anyone know what the correct formatting is so I can stylize my graphs? [memory] FNPATTERN ^memory.(.+).rrd TITLE Memory Utilization YAXIS % Used DEF:p at RRDIDX@=@RRDFN@:realmempct:AVERAGE LINE2:p at RRDIDX@#@COLOR@:@RRDPARAM@ -u 100 -b 1024 *-c BACK#363636** ** -c CANVAS#000000** ** -c SHADEA#CFCFCF** ** -c SHADEB#CFCFCF** ** -c GRID#222222** ** -c MGRID#441E1E** ** -c FONT#FFFFFF** ** -c AXIS#696969** ** -c FRAME#000000** ** -c ARROW#FA0016* GPRINT:p at RRDIDX@:LAST: \: %5.1lf (cur) GPRINT:p at RRDIDX@:MAX: \: %5.1lf (max) GPRINT:p at RRDIDX@:MIN: \: %5.1lf (min) GPRINT:p at RRDIDX@:AVERAGE: \: %5.1lf (avg)\n Kris Springer On 11/27/18 2:02 PM, Jean-Pierre Pitout [ MTN South Africa ] wrote:Something similar to Grafana would be awesome! It provides a very rich set of graphing options. (see image below) No idea if RRDs can be used though. Reference - http://docs.grafana.org/features/panels/graph/ // /________________________________________________ Jean-Pierre Pitout [ MTN South Africa ] Senior Linux Engineer (RHCA) IS Client Server Line-Of-Business Linux user-ea0bd803d592@xymon.invalid / *From:* Xymon <xymon-bounces at xymon.com> <mailto:xymon-bounces at xymon.com> on behalf of Kris Springer <user-c2caa0a7a8d5@xymon.invalid> <mailto:user-c2caa0a7a8d5@xymon.invalid> *Sent:* 27 November 2018 19:24 *To:* Xymon MailingList *Subject:* [Xymon] graph themes Can anyone advise on how to theme the graphs a bit? After 20 years of the light gray rectangles I'd like them to look a little more modern. -- Kris Springer *"This email is confidential. If you have received it in error, you are on notice of its status. Please notify us immediately by reply email and then delete this message from your system. Please do not copy it or use it for any purpose, or disclose its contents to any other person as to do so could be a breach of confidentiality. Thank you for your co-operation. "* “The information contained in this message is intended solely for the individual to whom it is specifically and originally addressed. This message and its contents may contain confidential or privileged information from MTN Group. If you are not the intended recipient, you are hereby notified that any disclosure or distribution, is strictly prohibited. If you receive this email in error, please notify MTN Group immediately and delete it. MTN Group does not accept any liability or responsibility if action is taken in reliance on the contents of this information . Note that all personal emails are not authorized by MTN Group. ”
list Ralph Mitchell
Individual line colors are listed in xymon/server/etc/graphs.cfg.  E.g. the
clock graph line is 00CC00 (mostly green):

[clock]
        TITLE Clock offset
        YAXIS Seconds
        DEF:offset=clock.rrd:la:AVERAGE
        LINE2:offset#00CC00:Seconds
                               ^^^

The default colors for the @RRDIDX@ multi line graphs are set in
xymon-4.3.28/web/showgraph.c:

     char *colorlist[] = {
             "0000FF", "FF0000", "00CC00", "FF00FF",
             "555555", "880000", "000088", "008800",
             "008888", "888888", "880088", "FFFF00",
             "888800", "00FFFF", "00FF00", "AA8800",
             "AAAAAA", "DD8833", "DDCC33", "8888FF",
             "5555AA", "B428D3", "FF5555", "DDDDDD",
             "AAFFAA", "AAFFFF", "FFAAFF", "FFAA55",
             "55AAFF", "AA55FF",
             NULL
     };

You'd need to recompile showgraph.cgi to change those.  I don't know if
there's any place to change those without a recompile.

Ralph Mitchell


On Wed, Nov 28, 2018 at 12:15 PM Kris Springer <user-c2caa0a7a8d5@xymon.invalid>
▸
wrote:
Just to close the loop on this conversation, here's what I added to my
xymonserver.cfg file to get my graphs the way I wanted.  As previously
stated the opts are all on one long line.

# graph theme
# values can be found at
https://oss.oetiker.ch/rrdtool/doc/rrdgraph.en.html
RRDGRAPHOPTS="-E -R light --border 0 --dynamic-labels -a PNG --grid-dash
1:0 -n LEGEND:8:Roboto -n TITLE:9:Roboto -n AXIS:7:Roboto -n UNIT:7:Roboto
-n WATERMARK:.1:Roboto -c BACK#262626 -c CANVAS#000000 -c SHADEA#000000 -c
SHADEB#000000 -c GRID#00000000 -c MGRID#DDDDDD11 -c FONT#DDDDDD -c
AXIS#262626 -c FRAME#000000 -c ARROW#262626"

I'd still like rounded corners and I haven't figured out how to change the
graph line colors, but that's not a big deal for me at this moment.

Kris Springer


On 11/27/18 6:21 PM, Ralph Mitchell wrote:

There may be a better place to put this, but it works for me.  In:

     /home/xymon/server/etc/xymonserver.cfg

add this as one long line:

RRDGRAPHOPTS="-c BACK#363636 -c CANVAS#000000 -c SHADEA#CFCFCF -c
SHADEB#CFCFCF -c GRID#222222 -c MGRID#441E1E -c FONT#FFFFFF -c AXIS#696969
-c FRAME#000000 -c ARROW#FA0016"

Take them out of the graphs.cfg file.  I don't know if it's strictly
necessary to restart Xymon, but I did, and all the graphs now come up with
those colors.  Not sure how to make it work with individual graphs.

Ralph Mitchell


On Tue, Nov 27, 2018 at 7:33 PM Kris Springer <user-c2caa0a7a8d5@xymon.invalid>
wrote:
I tried adding the color lines into my graphs.cfg file as specified in this how-to https://oss.oetiker.ch/rrdtool/doc/rrdgraph.en.html I edited one section to see what would happen. It threw an error that said *invalid color def format* Here's the section of my graphs.cfg that I edited. Anyone know what the correct formatting is so I can stylize my graphs? [memory] FNPATTERN ^memory.(.+).rrd TITLE Memory Utilization YAXIS % Used DEF:p at RRDIDX@=@RRDFN@:realmempct:AVERAGE LINE2:p at RRDIDX@#@COLOR@:@RRDPARAM@ -u 100 -b 1024 *-c BACK#363636* * -c CANVAS#000000* * -c SHADEA#CFCFCF* * -c SHADEB#CFCFCF* * -c GRID#222222* * -c MGRID#441E1E* * -c FONT#FFFFFF* * -c AXIS#696969* * -c FRAME#000000* * -c ARROW#FA0016* GPRINT:p at RRDIDX@:LAST: \: %5.1lf (cur) GPRINT:p at RRDIDX@:MAX: \: %5.1lf (max) GPRINT:p at RRDIDX@:MIN: \: %5.1lf (min) GPRINT:p at RRDIDX@:AVERAGE: \: %5.1lf (avg)\n Kris Springer On 11/27/18 2:02 PM, Jean-Pierre Pitout [ MTN South Africa ] wrote: Something similar to Grafana would be awesome! It provides a very rich set of graphing options. (see image below) No idea if RRDs can be used though. Reference - http://docs.grafana.org/features/panels/graph/ * ________________________________________________ Jean-Pierre Pitout [ MTN South Africa ] Senior Linux Engineer (RHCA) IS Client Server Line-Of-Business Linux user-ea0bd803d592@xymon.invalid <user-ea0bd803d592@xymon.invalid> * *From:* Xymon <xymon-bounces at xymon.com> <xymon-bounces at xymon.com> on behalf of Kris Springer <user-c2caa0a7a8d5@xymon.invalid> <user-c2caa0a7a8d5@xymon.invalid> *Sent:* 27 November 2018 19:24 *To:* Xymon MailingList *Subject:* [Xymon] graph themes Can anyone advise on how to theme the graphs a bit? After 20 years of the light gray rectangles I'd like them to look a little more modern. -- Kris Springer *"This email is confidential. If you have received it in error, you are on notice of its status. Please notify us immediately by reply email and then delete this message from your system. Please do not copy it or use it for any purpose, or disclose its contents to any other person as to do so could be a breach of confidentiality. Thank you for your co-operation. "* “The information contained in this message is intended solely for the individual to whom it is specifically and originally addressed. This message and its contents may contain confidential or privileged information from MTN Group. If you are not the intended recipient, you are hereby notified that any disclosure or distribution, is strictly prohibited. If you receive this email in error, please notify MTN Group immediately and delete it. MTN Group does not accept any liability or responsibility if action is taken in reliance on the contents of this information . Note that all personal emails are not authorized by MTN Group. ”
list Kris Springer
Here's how to round the corners of your graphs to make them look a
little more modern.  You can edit the radius value to your liking.

Add the following to your /xymon/server/www/menu/_xymonmenu-blue.css_

*img[alt*="xymongraph"] { **
** border-radius: 20px; **
**}*


Kris Springer
▸
On 11/28/18 11:05 AM, Ralph Mitchell wrote:Individual line colors are listed in xymon/server/etc/graphs.cfg. E.g. the clock graph line is 00CC00 (mostly green): [clock] TITLE Clock offset YAXIS Seconds DEF:offset=clock.rrd:la:AVERAGE LINE2:offset#00CC00:Seconds
^^^
▸
The default colors for the @RRDIDX@ multi line graphs are set in
xymon-4.3.28/web/showgraph.c:

     char *colorlist[] = {
             "0000FF", "FF0000", "00CC00", "FF00FF",
             "555555", "880000", "000088", "008800",
             "008888", "888888", "880088", "FFFF00",
             "888800", "00FFFF", "00FF00", "AA8800",
             "AAAAAA", "DD8833", "DDCC33", "8888FF",
             "5555AA", "B428D3", "FF5555", "DDDDDD",
             "AAFFAA", "AAFFFF", "FFAAFF", "FFAA55",
             "55AAFF", "AA55FF",
             NULL
     };

You'd need to recompile showgraph.cgi to change those. I don't know if
there's any place to change those without a recompile.

Ralph Mitchell


On Wed, Nov 28, 2018 at 12:15 PM Kris Springer
<user-c2caa0a7a8d5@xymon.invalid <mailto:user-c2caa0a7a8d5@xymon.invalid>> wrote:

    Just to close the loop on this conversation, here's what I added
    to my xymonserver.cfg file to get my graphs the way I wanted.  As
    previously stated the opts are all on one long line.

    # graph theme
    # values can be found at
    https://oss.oetiker.ch/rrdtool/doc/rrdgraph.en.html
    RRDGRAPHOPTS="-E -R light --border 0 --dynamic-labels -a PNG
    --grid-dash 1:0 -n LEGEND:8:Roboto -n TITLE:9:Roboto -n
    AXIS:7:Roboto -n UNIT:7:Roboto -n WATERMARK:.1:Roboto -c
    BACK#262626 -c CANVAS#000000 -c SHADEA#000000 -c SHADEB#000000 -c
    GRID#00000000 -c MGRID#DDDDDD11 -c FONT#DDDDDD -c AXIS#262626 -c
    FRAME#000000 -c ARROW#262626"

    I'd still like rounded corners and I haven't figured out how to
    change the graph line colors, but that's not a big deal for me at
    this moment.

    Kris Springer


    On 11/27/18 6:21 PM, Ralph Mitchell wrote:
There may be a better place to put this, but it works for me. In: /home/xymon/server/etc/xymonserver.cfg add this as one long line: RRDGRAPHOPTS="-c BACK#363636 -c CANVAS#000000 -c SHADEA#CFCFCF -c SHADEB#CFCFCF -c GRID#222222 -c MGRID#441E1E -c FONT#FFFFFF -c AXIS#696969 -c FRAME#000000 -c ARROW#FA0016" Take them out of the graphs.cfg file. I don't know if it's strictly necessary to restart Xymon, but I did, and all the graphs now come up with those colors. Not sure how to make it work with individual graphs. Ralph Mitchell On Tue, Nov 27, 2018 at 7:33 PM Kris Springer <user-c2caa0a7a8d5@xymon.invalid <mailto:user-c2caa0a7a8d5@xymon.invalid>> wrote: I tried adding the color lines into my graphs.cfg file as specified in this how-to https://oss.oetiker.ch/rrdtool/doc/rrdgraph.en.html I edited one section to see what would happen. It threw an error that said _*invalid color def format*_ Here's the section of my graphs.cfg that I edited. Anyone know what the correct formatting is so I can stylize my graphs? [memory] FNPATTERN ^memory.(.+).rrd TITLE Memory Utilization YAXIS % Used DEF:p at RRDIDX@=@RRDFN@:realmempct:AVERAGE LINE2:p at RRDIDX@#@COLOR@:@RRDPARAM@ -u 100 -b 1024 *-c BACK#363636** ** -c CANVAS#000000** ** -c SHADEA#CFCFCF** ** -c SHADEB#CFCFCF** ** -c GRID#222222** ** -c MGRID#441E1E** ** -c FONT#FFFFFF** ** -c AXIS#696969** ** -c FRAME#000000** ** -c ARROW#FA0016* GPRINT:p at RRDIDX@:LAST: \: %5.1lf (cur) GPRINT:p at RRDIDX@:MAX: \: %5.1lf (max) GPRINT:p at RRDIDX@:MIN: \: %5.1lf (min) GPRINT:p at RRDIDX@:AVERAGE: \: %5.1lf (avg)\n Kris Springer On 11/27/18 2:02 PM, Jean-Pierre Pitout [ MTN South Africa ] wrote:Something similar to Grafana would be awesome! It provides a very rich set of graphing options. (see image below) No idea if RRDs can be used though. Reference - http://docs.grafana.org/features/panels/graph/ // /________________________________________________ Jean-Pierre Pitout [ MTN South Africa ] Senior Linux Engineer (RHCA) IS Client Server Line-Of-Business Linux user-ea0bd803d592@xymon.invalid / *From:* Xymon <xymon-bounces at xymon.com> <mailto:xymon-bounces at xymon.com> on behalf of Kris Springer <user-c2caa0a7a8d5@xymon.invalid> <mailto:user-c2caa0a7a8d5@xymon.invalid> *Sent:* 27 November 2018 19:24 *To:* Xymon MailingList *Subject:* [Xymon] graph themes Can anyone advise on how to theme the graphs a bit? After 20 years of the light gray rectangles I'd like them to look a little more modern. -- Kris Springer *"This email is confidential. If you have received it in error, you are on notice of its status. Please notify us immediately by reply email and then delete this message from your system. Please do not copy it or use it for any purpose, or disclose its contents to any other person as to do so could be a breach of confidentiality. Thank you for your co-operation. "* “The information contained in this message is intended solely for the individual to whom it is specifically and originally addressed. This message and its contents may contain confidential or privileged information from MTN Group. If you are not the intended recipient, you are hereby notified that any disclosure or distribution, is strictly prohibited. If you receive this email in error, please notify MTN Group immediately and delete it. MTN Group does not accept any liability or responsibility if action is taken in reliance on the contents of this information . Note that all personal emails are not authorized by MTN Group. ”
list Kris Springer
Here's the full instructions on how to theme xymon graphs.
https://www.krisspringer.com/posts/xymon-graph-theming.php

Kris Springer
▸
On 11/27/18 7:46 PM, Ralph Mitchell wrote:Excellent! I may do something like that at work. Slowly change the colors over a month or so and see how long it takes anyone to notice... :) Ralph Mitchell On Tue, Nov 27, 2018 at 9:08 PM Kris Springer <user-c2caa0a7a8d5@xymon.invalid <mailto:user-c2caa0a7a8d5@xymon.invalid>> wrote: Thanks Ralph! That works perfectly! And there's no need to restart anything. The graphs appeared differently with just a web page refresh. Kris Springer On 11/27/18 6:21 PM, Ralph Mitchell wrote:There may be a better place to put this, but it works for me. In: /home/xymon/server/etc/xymonserver.cfg add this as one long line: RRDGRAPHOPTS="-c BACK#363636 -c CANVAS#000000 -c SHADEA#CFCFCF -c SHADEB#CFCFCF -c GRID#222222 -c MGRID#441E1E -c FONT#FFFFFF -c AXIS#696969 -c FRAME#000000 -c ARROW#FA0016" Take them out of the graphs.cfg file. I don't know if it's strictly necessary to restart Xymon, but I did, and all the graphs now come up with those colors. Not sure how to make it work with individual graphs. Ralph Mitchell On Tue, Nov 27, 2018 at 7:33 PM Kris Springer <user-c2caa0a7a8d5@xymon.invalid <mailto:user-c2caa0a7a8d5@xymon.invalid>> wrote: I tried adding the color lines into my graphs.cfg file as specified in this how-to https://oss.oetiker.ch/rrdtool/doc/rrdgraph.en.html I edited one section to see what would happen. It threw an error that said _*invalid color def format*_ Here's the section of my graphs.cfg that I edited. Anyone know what the correct formatting is so I can stylize my graphs? [memory] FNPATTERN ^memory.(.+).rrd TITLE Memory Utilization YAXIS % Used DEF:p at RRDIDX@=@RRDFN@:realmempct:AVERAGE LINE2:p at RRDIDX@#@COLOR@:@RRDPARAM@ -u 100 -b 1024 *-c BACK#363636** ** -c CANVAS#000000** ** -c SHADEA#CFCFCF** ** -c SHADEB#CFCFCF** ** -c GRID#222222** ** -c MGRID#441E1E** ** -c FONT#FFFFFF** ** -c AXIS#696969** ** -c FRAME#000000** ** -c ARROW#FA0016* GPRINT:p at RRDIDX@:LAST: \: %5.1lf (cur) GPRINT:p at RRDIDX@:MAX: \: %5.1lf (max) GPRINT:p at RRDIDX@:MIN: \: %5.1lf (min) GPRINT:p at RRDIDX@:AVERAGE: \: %5.1lf (avg)\n Kris Springer On 11/27/18 2:02 PM, Jean-Pierre Pitout [ MTN South Africa ] wrote:Something similar to Grafana would be awesome! It provides a very rich set of graphing options. (see image below) No idea if RRDs can be used though. Reference - http://docs.grafana.org/features/panels/graph/ // /________________________________________________ Jean-Pierre Pitout [ MTN South Africa ] Senior Linux Engineer (RHCA) IS Client Server Line-Of-Business Linux user-ea0bd803d592@xymon.invalid / *From:* Xymon <xymon-bounces at xymon.com> <mailto:xymon-bounces at xymon.com> on behalf of Kris Springer <user-c2caa0a7a8d5@xymon.invalid> <mailto:user-c2caa0a7a8d5@xymon.invalid> *Sent:* 27 November 2018 19:24 *To:* Xymon MailingList *Subject:* [Xymon] graph themes Can anyone advise on how to theme the graphs a bit? After 20 years of the light gray rectangles I'd like them to look a little more modern. -- Kris Springer *"This email is confidential. If you have received it in error, you are on notice of its status. Please notify us immediately by reply email and then delete this message from your system. Please do not copy it or use it for any purpose, or disclose its contents to any other person as to do so could be a breach of confidentiality. Thank you for your co-operation. "* “The information contained in this message is intended solely for the individual to whom it is specifically and originally addressed. This message and its contents may contain confidential or privileged information from MTN Group. If you are not the intended recipient, you are hereby notified that any disclosure or distribution, is strictly prohibited. If you receive this email in error, please notify MTN Group immediately and delete it. MTN Group does not accept any liability or responsibility if action is taken in reliance on the contents of this information . Note that all personal emails are not authorized by MTN Group. ”
list Ralph Mitchell
I just noticed that the rounded graph corners don't show on the
hourly/daily/weekly/monthly graphs page you get to when clicking through a
graph.  Those are labelled differently.  In
xymon/server/etc/www/menu/xymonmenu-blue.css add these:

   img[alt*="hourly graph"] {
      border-radius: 20px;
   }
   img[alt*="daily graph"] {
      border-radius: 20px;
   }
   img[alt*="weekly graph"] {
      border-radius: 20px;
   }
   img[alt*="monthly graph"] {
      border-radius: 20px;
   }


Ralph Mitchell


On Thu, Nov 29, 2018 at 10:20 AM Kris Springer <user-c2caa0a7a8d5@xymon.invalid>
▸
wrote:
Here's the full instructions on how to theme xymon graphs.
https://www.krisspringer.com/posts/xymon-graph-theming.php

Kris Springer


On 11/27/18 7:46 PM, Ralph Mitchell wrote:

Excellent!  I may do something like that at work.  Slowly change the
colors over a month or so and see how long it takes anyone to notice...  :)

Ralph Mitchell


On Tue, Nov 27, 2018 at 9:08 PM Kris Springer <user-c2caa0a7a8d5@xymon.invalid>
wrote:
Thanks Ralph! That works perfectly! And there's no need to restart anything. The graphs appeared differently with just a web page refresh. Kris Springer On 11/27/18 6:21 PM, Ralph Mitchell wrote: There may be a better place to put this, but it works for me. In: /home/xymon/server/etc/xymonserver.cfg add this as one long line: RRDGRAPHOPTS="-c BACK#363636 -c CANVAS#000000 -c SHADEA#CFCFCF -c SHADEB#CFCFCF -c GRID#222222 -c MGRID#441E1E -c FONT#FFFFFF -c AXIS#696969 -c FRAME#000000 -c ARROW#FA0016" Take them out of the graphs.cfg file. I don't know if it's strictly necessary to restart Xymon, but I did, and all the graphs now come up with those colors. Not sure how to make it work with individual graphs. Ralph Mitchell On Tue, Nov 27, 2018 at 7:33 PM Kris Springer <user-c2caa0a7a8d5@xymon.invalid> wrote:I tried adding the color lines into my graphs.cfg file as specified in this how-to https://oss.oetiker.ch/rrdtool/doc/rrdgraph.en.html I edited one section to see what would happen. It threw an error that said *invalid color def format* Here's the section of my graphs.cfg that I edited. Anyone know what the correct formatting is so I can stylize my graphs? [memory] FNPATTERN ^memory.(.+).rrd TITLE Memory Utilization YAXIS % Used DEF:p at RRDIDX@=@RRDFN@:realmempct:AVERAGE LINE2:p at RRDIDX@#@COLOR@:@RRDPARAM@ -u 100 -b 1024 *-c BACK#363636* * -c CANVAS#000000* * -c SHADEA#CFCFCF* * -c SHADEB#CFCFCF* * -c GRID#222222* * -c MGRID#441E1E* * -c FONT#FFFFFF* * -c AXIS#696969* * -c FRAME#000000* * -c ARROW#FA0016* GPRINT:p at RRDIDX@:LAST: \: %5.1lf (cur) GPRINT:p at RRDIDX@:MAX: \: %5.1lf (max) GPRINT:p at RRDIDX@:MIN: \: %5.1lf (min) GPRINT:p at RRDIDX@:AVERAGE: \: %5.1lf (avg)\n Kris Springer On 11/27/18 2:02 PM, Jean-Pierre Pitout [ MTN South Africa ] wrote: Something similar to Grafana would be awesome! It provides a very rich set of graphing options. (see image below) No idea if RRDs can be used though. Reference - http://docs.grafana.org/features/panels/graph/ * ________________________________________________ Jean-Pierre Pitout [ MTN South Africa ] Senior Linux Engineer (RHCA) IS Client Server Line-Of-Business Linux user-ea0bd803d592@xymon.invalid <user-ea0bd803d592@xymon.invalid> * *From:* Xymon <xymon-bounces at xymon.com> <xymon-bounces at xymon.com> on behalf of Kris Springer <user-c2caa0a7a8d5@xymon.invalid> <user-c2caa0a7a8d5@xymon.invalid> *Sent:* 27 November 2018 19:24 *To:* Xymon MailingList *Subject:* [Xymon] graph themes Can anyone advise on how to theme the graphs a bit? After 20 years of the light gray rectangles I'd like them to look a little more modern. -- Kris Springer *"This email is confidential. If you have received it in error, you are on notice of its status. Please notify us immediately by reply email and then delete this message from your system. Please do not copy it or use it for any purpose, or disclose its contents to any other person as to do so could be a breach of confidentiality. Thank you for your co-operation. "* “The information contained in this message is intended solely for the individual to whom it is specifically and originally addressed. This message and its contents may contain confidential or privileged information from MTN Group. If you are not the intended recipient, you are hereby notified that any disclosure or distribution, is strictly prohibited. If you receive this email in error, please notify MTN Group immediately and delete it. MTN Group does not accept any liability or responsibility if action is taken in reliance on the contents of this information . Note that all personal emails are not authorized by MTN Group. ”
list Kris Springer
Correct, that's why in my final instructions I added a second css line
for "Zoom" instead of defining each graph.  Either way it works.  :-)

Kris Springer
▸
On 11/29/18 8:44 AM, Ralph Mitchell wrote:I just noticed that the rounded graph corners don't show on the hourly/daily/weekly/monthly graphs page you get to when clicking through a graph. Those are labelled differently. In xymon/server/etc/www/menu/xymonmenu-blue.css add these: img[alt*="hourly graph"] { border-radius: 20px; } img[alt*="daily graph"] { border-radius: 20px; } img[alt*="weekly graph"] { border-radius: 20px; } img[alt*="monthly graph"] { border-radius: 20px; } Ralph Mitchell On Thu, Nov 29, 2018 at 10:20 AM Kris Springer <user-c2caa0a7a8d5@xymon.invalid <mailto:user-c2caa0a7a8d5@xymon.invalid>> wrote: Here's the full instructions on how to theme xymon graphs. https://www.krisspringer.com/posts/xymon-graph-theming.php Kris Springer On 11/27/18 7:46 PM, Ralph Mitchell wrote:Excellent! I may do something like that at work. Slowly change the colors over a month or so and see how long it takes anyone to notice... :) Ralph Mitchell On Tue, Nov 27, 2018 at 9:08 PM Kris Springer <user-c2caa0a7a8d5@xymon.invalid <mailto:user-c2caa0a7a8d5@xymon.invalid>> wrote: Thanks Ralph! That works perfectly! And there's no need to restart anything. The graphs appeared differently with just a web page refresh. Kris Springer On 11/27/18 6:21 PM, Ralph Mitchell wrote:There may be a better place to put this, but it works for me. In: /home/xymon/server/etc/xymonserver.cfg add this as one long line: RRDGRAPHOPTS="-c BACK#363636 -c CANVAS#000000 -c SHADEA#CFCFCF -c SHADEB#CFCFCF -c GRID#222222 -c MGRID#441E1E -c FONT#FFFFFF -c AXIS#696969 -c FRAME#000000 -c ARROW#FA0016" Take them out of the graphs.cfg file. I don't know if it's strictly necessary to restart Xymon, but I did, and all the graphs now come up with those colors. Not sure how to make it work with individual graphs. Ralph Mitchell On Tue, Nov 27, 2018 at 7:33 PM Kris Springer <user-c2caa0a7a8d5@xymon.invalid <mailto:user-c2caa0a7a8d5@xymon.invalid>> wrote: I tried adding the color lines into my graphs.cfg file as specified in this how-to https://oss.oetiker.ch/rrdtool/doc/rrdgraph.en.html I edited one section to see what would happen. It threw an error that said _*invalid color def format*_ Here's the section of my graphs.cfg that I edited. Anyone know what the correct formatting is so I can stylize my graphs? [memory] FNPATTERN ^memory.(.+).rrd TITLE Memory Utilization YAXIS % Used DEF:p at RRDIDX@=@RRDFN@:realmempct:AVERAGE LINE2:p at RRDIDX@#@COLOR@:@RRDPARAM@ -u 100 -b 1024 *-c BACK#363636** ** -c CANVAS#000000** ** -c SHADEA#CFCFCF** ** -c SHADEB#CFCFCF** ** -c GRID#222222** ** -c MGRID#441E1E** ** -c FONT#FFFFFF** ** -c AXIS#696969** ** -c FRAME#000000** ** -c ARROW#FA0016* GPRINT:p at RRDIDX@:LAST: \: %5.1lf (cur) GPRINT:p at RRDIDX@:MAX: \: %5.1lf (max) GPRINT:p at RRDIDX@:MIN: \: %5.1lf (min) GPRINT:p at RRDIDX@:AVERAGE: \: %5.1lf (avg)\n Kris Springer On 11/27/18 2:02 PM, Jean-Pierre Pitout [ MTN South Africa ] wrote:Something similar to Grafana would be awesome! It provides a very rich set of graphing options. (see image below) No idea if RRDs can be used though. Reference - http://docs.grafana.org/features/panels/graph/ // /________________________________________________ Jean-Pierre Pitout [ MTN South Africa ] Senior Linux Engineer (RHCA) IS Client Server Line-Of-Business Linux user-ea0bd803d592@xymon.invalid / *From:* Xymon <xymon-bounces at xymon.com> <mailto:xymon-bounces at xymon.com> on behalf of Kris Springer <user-c2caa0a7a8d5@xymon.invalid> *Sent:* 27 November 2018 19:24 *To:* Xymon MailingList *Subject:* [Xymon] graph themes Can anyone advise on how to theme the graphs a bit? After 20 years of the light gray rectangles I'd like them to look a little more modern. -- Kris Springer *"This email is confidential. If you have received it in error, you are on notice of its status. Please notify us immediately by reply email and then delete this message from your system. Please do not copy it or use it for any purpose, or disclose its contents to any other person as to do so could be a breach of confidentiality. Thank you for your co-operation. "* “The information contained in this message is intended solely for the individual to whom it is specifically and originally addressed. This message and its contents may contain confidential or privileged information from MTN Group. If you are not the intended recipient, you are hereby notified that any disclosure or distribution, is strictly prohibited. If you receive this email in error, please notify MTN Group immediately and delete it. MTN Group does not accept any liability or responsibility if action is taken in reliance on the contents of this information . Note that all personal emails are not authorized by MTN Group. ”