All Xymon rrd graphs suddenly haywire
list Steve B
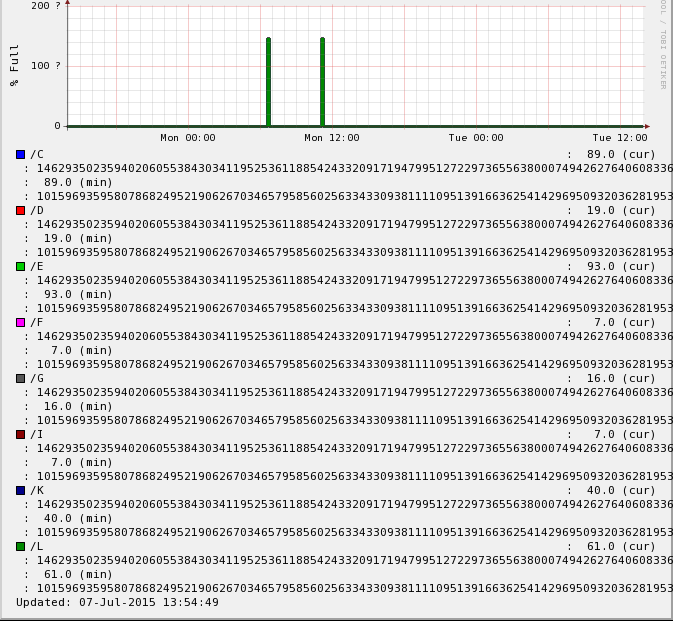
Hi all,

This weekend, something happened with all our graphs. Every hosts' graphs
are either corrupted or distorted and the history is unusable. I have
checked all the usual places for graphs logging, rrd-data.log and
rrd-status.log and other system log files but I am stumped as to where to
start fixing this.  We are looking at restoring rrds from previous snapshot
which may or may not work but still would like to solve this mystery.

I have attached 2 screens but I do not know if these are viewable on the
mailing list.  It is hard to explain without but essentially there are huge
numbers in our graphs such
3945789385793485793847593847593847593847593847593845793485739 and lots of
'?' and there is no usable history, just a straight line along the base
with one peak (or two) around the time this all happened (with a day or two
out either way). If you try to zoom in, you get to a screen that just says
'zoom source image' and it's a black screen but if you hover your mouse
over the screen you can find an area that is selectable and this shows a
close up of the zoom area

rrdtool info example (for the same screenshot host test):

filename = "disk,C.rrd"
rrd_version = "0003"
step = 300
last_update = 1436270189
ds[pct].type = "GAUGE"
ds[pct].minimal_heartbeat = 600
ds[pct].min = 0.0000000000e+00
ds[pct].max = 1.0000000000e+02
ds[pct].last_ds = "89"
ds[pct].value = 7.9210000000e+03
ds[pct].unknown_sec = 0
ds[used].type = "GAUGE"
ds[used].minimal_heartbeat = 600
ds[used].min = 0.0000000000e+00
ds[used].max = NaN
ds[used].last_ds = "28436524"
ds[used].value = 2.5308506360e+09
ds[used].unknown_sec = 0
rra[0].cf = "AVERAGE"
rra[0].rows = 576
rra[0].pdp_per_row = 1
rra[0].xff = 5.0000000000e-01
rra[0].cdp_prep[0].value = NaN
rra[0].cdp_prep[0].unknown_datapoints = 0
rra[0].cdp_prep[1].value = NaN
rra[0].cdp_prep[1].unknown_datapoints = 0
rra[1].cf = "AVERAGE"
rra[1].rows = 576
rra[1].pdp_per_row = 6
rra[1].xff = 5.0000000000e-01
rra[1].cdp_prep[0].value = 4.4500000000e+02
rra[1].cdp_prep[0].unknown_datapoints = 0
rra[1].cdp_prep[1].value = 1.4218146600e+08
rra[1].cdp_prep[1].unknown_datapoints = 0
rra[2].cf = "AVERAGE"
rra[2].rows = 576
rra[2].pdp_per_row = 24
rra[2].xff = 5.0000000000e-01
rra[2].cdp_prep[0].value = 2.0470000000e+03
rra[2].cdp_prep[0].unknown_datapoints = 0
rra[2].cdp_prep[1].value = 6.5402986560e+08
rra[2].cdp_prep[1].unknown_datapoints = 0
rra[3].cf = "AVERAGE"
rra[3].rows = 576
rra[3].pdp_per_row = 288
rra[3].xff = 5.0000000000e-01
rra[3].cdp_prep[0].value = 1.2727000000e+04
rra[3].cdp_prep[0].unknown_datapoints = 0
rra[3].cdp_prep[1].value = 4.0657944878e+09
rra[3].cdp_prep[1].unknown_datapoints = 0

This weekend we had a network intervention in that we moved some network
connections in one of the 2 data centers but there was no downtime as we
switched the network connectivity to the other data room. Our Xymon server
is running on a virtual server (RHEL5) and the version we are using is
4.3.19.

All graphs were fine until this point.  Any ideas?
Attachments (2)
 attachment.png
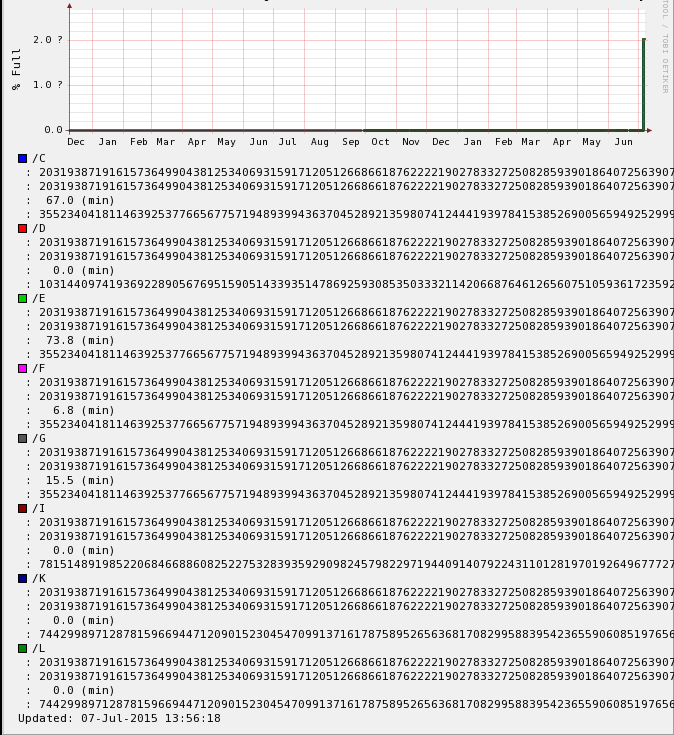 attachment-0001.png
list Japheth Cleaver
▸
On Tue, July 7, 2015 5:13 am, Steve B wrote:
Hi all,

This weekend, something happened with all our graphs. Every hosts' graphs
are either corrupted or distorted and the history is unusable. I have
checked all the usual places for graphs logging, rrd-data.log and
rrd-status.log and other system log files but I am stumped as to where to
start fixing this.  We are looking at restoring rrds from previous
snapshot
which may or may not work but still would like to solve this mystery.

I have attached 2 screens but I do not know if these are viewable on the
mailing list.  It is hard to explain without but essentially there are
huge
numbers in our graphs such
3945789385793485793847593847593847593847593847593845793485739 and lots of
'?' and there is no usable history, just a straight line along the base
with one peak (or two) around the time this all happened (with a day or
two
out either way). If you try to zoom in, you get to a screen that just says
'zoom source image' and it's a black screen but if you hover your mouse
over the screen you can find an area that is selectable and this shows a
close up of the zoom area

rrdtool info example (for the same screenshot host test):

filename = "disk,C.rrd"
rrd_version = "0003"
step = 300
last_update = 1436270189
ds[pct].type = "GAUGE"
ds[pct].minimal_heartbeat = 600
ds[pct].min = 0.0000000000e+00
ds[pct].max = 1.0000000000e+02
ds[pct].last_ds = "89"
ds[pct].value = 7.9210000000e+03
ds[pct].unknown_sec = 0
ds[used].type = "GAUGE"
ds[used].minimal_heartbeat = 600
ds[used].min = 0.0000000000e+00
ds[used].max = NaN
ds[used].last_ds = "28436524"
ds[used].value = 2.5308506360e+09
ds[used].unknown_sec = 0
rra[0].cf = "AVERAGE"
rra[0].rows = 576
rra[0].pdp_per_row = 1
rra[0].xff = 5.0000000000e-01
rra[0].cdp_prep[0].value = NaN
rra[0].cdp_prep[0].unknown_datapoints = 0
rra[0].cdp_prep[1].value = NaN
rra[0].cdp_prep[1].unknown_datapoints = 0
rra[1].cf = "AVERAGE"
rra[1].rows = 576
rra[1].pdp_per_row = 6
rra[1].xff = 5.0000000000e-01
rra[1].cdp_prep[0].value = 4.4500000000e+02
rra[1].cdp_prep[0].unknown_datapoints = 0
rra[1].cdp_prep[1].value = 1.4218146600e+08
rra[1].cdp_prep[1].unknown_datapoints = 0
rra[2].cf = "AVERAGE"
rra[2].rows = 576
rra[2].pdp_per_row = 24
rra[2].xff = 5.0000000000e-01
rra[2].cdp_prep[0].value = 2.0470000000e+03
rra[2].cdp_prep[0].unknown_datapoints = 0
rra[2].cdp_prep[1].value = 6.5402986560e+08
rra[2].cdp_prep[1].unknown_datapoints = 0
rra[3].cf = "AVERAGE"
rra[3].rows = 576
rra[3].pdp_per_row = 288
rra[3].xff = 5.0000000000e-01
rra[3].cdp_prep[0].value = 1.2727000000e+04
rra[3].cdp_prep[0].unknown_datapoints = 0
rra[3].cdp_prep[1].value = 4.0657944878e+09
rra[3].cdp_prep[1].unknown_datapoints = 0

This weekend we had a network intervention in that we moved some network
connections in one of the 2 data centers but there was no downtime as we
switched the network connectivity to the other data room. Our Xymon server
is running on a virtual server (RHEL5) and the version we are using is
4.3.19.

All graphs were fine until this point.  Any ideas?
This is quite odd.

There aren't too many things that could concertedly affect all RRD's like
that within the code path. Is it the same type of RRD (eg, disk) for all
hosts, or all RRDs for all hosts? Did you see anything unusual in the
status history snapshots (if any) taken around this time?

If it happened to RRDs on both the 'data' and 'status' channels at once,
that narrows down the possibilities even further. I'm assuming you've
checked syslog for host level events for the VM, but did anything odd
happen with the hypervisor around this time? General host memory
corruption is about the only thing I can think of that might cause this --
haven't run into it before.


Regarding fixing the issue, restoring from backups might be the easiest
option. If you want to save the surrounding data, your best bet might be
to export/reimport the RRD to remove the "spike". I've used
http://www.serveradminblog.com/2010/11/remove-spikes-from-rrd-graphs-howto/
in the past for doing this. It's easiest to script around the various
types of RRD files, using a similar max setting for all "la" graphs, for
example.

I seem to recall someone posting a script they had used for this in the
past, but a search of the list archives hasn't revealed anything for me.


HTH,

-jc
list Steve B
It is extremely odd J.C. and thanks very much for your reply, has given me
something to think about. I am not at the office now but before I left,
after the copying over of the rrds files from Friday all looked ok, graphs
were being generated properly, from xymon, bbwin from hosts and devmon.
Then an hour later just as I was leaving, I saw a few checks having the
issue again. It was slowly starting again. I had decided I had to do the
*restore* of the rrds though just for peace of mind about the network
intervention at the weekend not being anything to do with this whole issue
(which would be very unlikely in the first place) so now I can be sure that
is not the culprit.

To answer your question, it is all (bar none actually) types of RRD (conn,
disk, memory, devmon etc).  I did not see anything unusual in the status
history around that time, but now that it has happened again today after
the restore, I have some good time stamps to check through log files
tomorrow.  Perhaps not all hosts/checks will be affected by the time I
arrive at the office tomorrow.

At the vm level I have not checked yet (handled by another team) but will
do tomorrow. I did check the server from within RHEL and cpu/memory/disk
seemed fine today and last few days.

I still think it's (our) Xymon that's having some difficulties somewhere
although general host memory corruption is something I will look at.

Thanks again, will post more when I make some discoveries.

Steve
▸
On Tue, Jul 7, 2015 at 6:02 PM, J.C. Cleaver <user-87556346d4af@xymon.invalid> wrote:
On Tue, July 7, 2015 5:13 am, Steve B wrote:Hi all, This weekend, something happened with all our graphs. Every hosts' graphs are either corrupted or distorted and the history is unusable. I have checked all the usual places for graphs logging, rrd-data.log and rrd-status.log and other system log files but I am stumped as to where to start fixing this. We are looking at restoring rrds from previous snapshot which may or may not work but still would like to solve this mystery. I have attached 2 screens but I do not know if these are viewable on the mailing list. It is hard to explain without but essentially there are huge numbers in our graphs such 3945789385793485793847593847593847593847593847593845793485739 and lots of '?' and there is no usable history, just a straight line along the base with one peak (or two) around the time this all happened (with a day or two out either way). If you try to zoom in, you get to a screen that just says 'zoom source image' and it's a black screen but if you hover your mouse over the screen you can find an area that is selectable and this shows a close up of the zoom area rrdtool info example (for the same screenshot host test): filename = "disk,C.rrd" rrd_version = "0003" step = 300 last_update = 1436270189 ds[pct].type = "GAUGE" ds[pct].minimal_heartbeat = 600 ds[pct].min = 0.0000000000e+00 ds[pct].max = 1.0000000000e+02 ds[pct].last_ds = "89" ds[pct].value = 7.9210000000e+03 ds[pct].unknown_sec = 0 ds[used].type = "GAUGE" ds[used].minimal_heartbeat = 600 ds[used].min = 0.0000000000e+00 ds[used].max = NaN ds[used].last_ds = "28436524" ds[used].value = 2.5308506360e+09 ds[used].unknown_sec = 0 rra[0].cf = "AVERAGE" rra[0].rows = 576 rra[0].pdp_per_row = 1 rra[0].xff = 5.0000000000e-01 rra[0].cdp_prep[0].value = NaN rra[0].cdp_prep[0].unknown_datapoints = 0 rra[0].cdp_prep[1].value = NaN rra[0].cdp_prep[1].unknown_datapoints = 0 rra[1].cf = "AVERAGE" rra[1].rows = 576 rra[1].pdp_per_row = 6 rra[1].xff = 5.0000000000e-01 rra[1].cdp_prep[0].value = 4.4500000000e+02 rra[1].cdp_prep[0].unknown_datapoints = 0 rra[1].cdp_prep[1].value = 1.4218146600e+08 rra[1].cdp_prep[1].unknown_datapoints = 0 rra[2].cf = "AVERAGE" rra[2].rows = 576 rra[2].pdp_per_row = 24 rra[2].xff = 5.0000000000e-01 rra[2].cdp_prep[0].value = 2.0470000000e+03 rra[2].cdp_prep[0].unknown_datapoints = 0 rra[2].cdp_prep[1].value = 6.5402986560e+08 rra[2].cdp_prep[1].unknown_datapoints = 0 rra[3].cf = "AVERAGE" rra[3].rows = 576 rra[3].pdp_per_row = 288 rra[3].xff = 5.0000000000e-01 rra[3].cdp_prep[0].value = 1.2727000000e+04 rra[3].cdp_prep[0].unknown_datapoints = 0 rra[3].cdp_prep[1].value = 4.0657944878e+09 rra[3].cdp_prep[1].unknown_datapoints = 0 This weekend we had a network intervention in that we moved some network connections in one of the 2 data centers but there was no downtime as we switched the network connectivity to the other data room. Our Xymon server is running on a virtual server (RHEL5) and the version we are using is 4.3.19. All graphs were fine until this point. Any ideas?This is quite odd. There aren't too many things that could concertedly affect all RRD's like that within the code path. Is it the same type of RRD (eg, disk) for all hosts, or all RRDs for all hosts? Did you see anything unusual in the status history snapshots (if any) taken around this time? If it happened to RRDs on both the 'data' and 'status' channels at once, that narrows down the possibilities even further. I'm assuming you've checked syslog for host level events for the VM, but did anything odd happen with the hypervisor around this time? General host memory corruption is about the only thing I can think of that might cause this -- haven't run into it before. Regarding fixing the issue, restoring from backups might be the easiest option. If you want to save the surrounding data, your best bet might be to export/reimport the RRD to remove the "spike". I've used http://www.serveradminblog.com/2010/11/remove-spikes-from-rrd-graphs-howto/ in the past for doing this. It's easiest to script around the various types of RRD files, using a similar max setting for all "la" graphs, for example. I seem to recall someone posting a script they had used for this in the past, but a search of the list archives hasn't revealed anything for me. HTH, -jc
list Ralph Mitchell
I had the exact same thing happen a couple of months ago, with
xymon-4.3.12.  I don't know what triggered it, and it was only a
short-duration spike, then everything returned to normal.

The majority of my client systems are real machines.  There are some VMs
running in qemu-kvm on RHEL5, and some other VMs in VMware

My xymon server is also a real machine,

Ralph Mitchell
▸
On Tue, Jul 7, 2015 at 4:36 PM, Steve B <user-df463d3c0721@xymon.invalid> wrote:
It is extremely odd J.C. and thanks very much for your reply, has given me
something to think about. I am not at the office now but before I left,
after the copying over of the rrds files from Friday all looked ok, graphs
were being generated properly, from xymon, bbwin from hosts and devmon.
Then an hour later just as I was leaving, I saw a few checks having the
issue again. It was slowly starting again. I had decided I had to do the
*restore* of the rrds though just for peace of mind about the network
intervention at the weekend not being anything to do with this whole issue
(which would be very unlikely in the first place) so now I can be sure that
is not the culprit.

To answer your question, it is all (bar none actually) types of RRD (conn,
disk, memory, devmon etc).  I did not see anything unusual in the status
history around that time, but now that it has happened again today after
the restore, I have some good time stamps to check through log files
tomorrow.  Perhaps not all hosts/checks will be affected by the time I
arrive at the office tomorrow.

At the vm level I have not checked yet (handled by another team) but will
do tomorrow. I did check the server from within RHEL and cpu/memory/disk
seemed fine today and last few days.

I still think it's (our) Xymon that's having some difficulties somewhere
although general host memory corruption is something I will look at.

Thanks again, will post more when I make some discoveries.

Steve

On Tue, Jul 7, 2015 at 6:02 PM, J.C. Cleaver <user-87556346d4af@xymon.invalid>
wrote:
On Tue, July 7, 2015 5:13 am, Steve B wrote:Hi all, This weekend, something happened with all our graphs. Every hosts' graphs are either corrupted or distorted and the history is unusable. I have checked all the usual places for graphs logging, rrd-data.log and rrd-status.log and other system log files but I am stumped as to where to start fixing this. We are looking at restoring rrds from previous snapshot which may or may not work but still would like to solve this mystery. I have attached 2 screens but I do not know if these are viewable on the mailing list. It is hard to explain without but essentially there are huge numbers in our graphs such 3945789385793485793847593847593847593847593847593845793485739 and lots of '?' and there is no usable history, just a straight line along the base with one peak (or two) around the time this all happened (with a day or two out either way). If you try to zoom in, you get to a screen that just says 'zoom source image' and it's a black screen but if you hover your mouse over the screen you can find an area that is selectable and this shows a close up of the zoom area rrdtool info example (for the same screenshot host test): filename = "disk,C.rrd" rrd_version = "0003" step = 300 last_update = 1436270189 ds[pct].type = "GAUGE" ds[pct].minimal_heartbeat = 600 ds[pct].min = 0.0000000000e+00 ds[pct].max = 1.0000000000e+02 ds[pct].last_ds = "89" ds[pct].value = 7.9210000000e+03 ds[pct].unknown_sec = 0 ds[used].type = "GAUGE" ds[used].minimal_heartbeat = 600 ds[used].min = 0.0000000000e+00 ds[used].max = NaN ds[used].last_ds = "28436524" ds[used].value = 2.5308506360e+09 ds[used].unknown_sec = 0 rra[0].cf = "AVERAGE" rra[0].rows = 576 rra[0].pdp_per_row = 1 rra[0].xff = 5.0000000000e-01 rra[0].cdp_prep[0].value = NaN rra[0].cdp_prep[0].unknown_datapoints = 0 rra[0].cdp_prep[1].value = NaN rra[0].cdp_prep[1].unknown_datapoints = 0 rra[1].cf = "AVERAGE" rra[1].rows = 576 rra[1].pdp_per_row = 6 rra[1].xff = 5.0000000000e-01 rra[1].cdp_prep[0].value = 4.4500000000e+02 rra[1].cdp_prep[0].unknown_datapoints = 0 rra[1].cdp_prep[1].value = 1.4218146600e+08 rra[1].cdp_prep[1].unknown_datapoints = 0 rra[2].cf = "AVERAGE" rra[2].rows = 576 rra[2].pdp_per_row = 24 rra[2].xff = 5.0000000000e-01 rra[2].cdp_prep[0].value = 2.0470000000e+03 rra[2].cdp_prep[0].unknown_datapoints = 0 rra[2].cdp_prep[1].value = 6.5402986560e+08 rra[2].cdp_prep[1].unknown_datapoints = 0 rra[3].cf = "AVERAGE" rra[3].rows = 576 rra[3].pdp_per_row = 288 rra[3].xff = 5.0000000000e-01 rra[3].cdp_prep[0].value = 1.2727000000e+04 rra[3].cdp_prep[0].unknown_datapoints = 0 rra[3].cdp_prep[1].value = 4.0657944878e+09 rra[3].cdp_prep[1].unknown_datapoints = 0 This weekend we had a network intervention in that we moved some network connections in one of the 2 data centers but there was no downtime as we switched the network connectivity to the other data room. Our Xymon server is running on a virtual server (RHEL5) and the version we are using is 4.3.19. All graphs were fine until this point. Any ideas?This is quite odd. There aren't too many things that could concertedly affect all RRD's like that within the code path. Is it the same type of RRD (eg, disk) for all hosts, or all RRDs for all hosts? Did you see anything unusual in the status history snapshots (if any) taken around this time? If it happened to RRDs on both the 'data' and 'status' channels at once, that narrows down the possibilities even further. I'm assuming you've checked syslog for host level events for the VM, but did anything odd happen with the hypervisor around this time? General host memory corruption is about the only thing I can think of that might cause this -- haven't run into it before. Regarding fixing the issue, restoring from backups might be the easiest option. If you want to save the surrounding data, your best bet might be to export/reimport the RRD to remove the "spike". I've used http://www.serveradminblog.com/2010/11/remove-spikes-from-rrd-graphs-howto/ in the past for doing this. It's easiest to script around the various types of RRD files, using a similar max setting for all "la" graphs, for example. I seem to recall someone posting a script they had used for this in the past, but a search of the list archives hasn't revealed anything for me. HTH, -jc
list Jeremy Laidman
On 7 July 2015 at 22:13, Steve B <user-df463d3c0721@xymon.invalid> wrote:
ds[pct].min = 0.0000000000e+00
ds[pct].max = 1.0000000000e+02
ds[pct].last_ds = "89"
ds[pct].value = 7.9210000000e+03
Well, this is interesting.  The "max" is set at 100%, but rrdtool accepted
a value of 7921%.

I've had this happen in the past, but haven't found the cause.  I ended up
doing an xport/edit/restore on each RRD file affected.  However, it's only
happened here and there.  I've never seen a widespread problem across lots
of graphs all at the same time.  My first thought was a counter-wrap
problem, but as I recall, I quickly eliminated that as a possible cause.

Are all affected graphs of type GAUGE?

J
list Steve B
It's pretty much all the graphs, GAUGE or not. We upgraded our rrdtool as
we were on an older version and it seemed ok for hours but then in the AM
there were some massive spikes and it has spread like wildfire and we are
back where we started.  Not all graphs are affected though. It seems random
but it's probably not.
Still looking at stats and graphs for the vm from inside and out. Very
frustrating all this!
Thanks

On Wed, Jul 8, 2015 at 3:14 AM, Jeremy Laidman <user-71895fb2e44c@xymon.invalid>
▸
wrote:
On 7 July 2015 at 22:13, Steve B <user-df463d3c0721@xymon.invalid> wrote:ds[pct].min = 0.0000000000e+00 ds[pct].max = 1.0000000000e+02 ds[pct].last_ds = "89" ds[pct].value = 7.9210000000e+03Well, this is interesting. The "max" is set at 100%, but rrdtool accepted a value of 7921%. I've had this happen in the past, but haven't found the cause. I ended up doing an xport/edit/restore on each RRD file affected. However, it's only happened here and there. I've never seen a widespread problem across lots of graphs all at the same time. My first thought was a counter-wrap problem, but as I recall, I quickly eliminated that as a possible cause. Are all affected graphs of type GAUGE? J
list Ralph Mitchell
I'm getting another set of massive spikes.  Everything that updated in the
last couple of days has this:

rra[3].cf = "AVERAGE"
rra[3].rows = 864
rra[3].pdp_per_row = 288
rra[3].xff = 5.0000000000e-01
rra[3].cdp_prep[0].value = 2.8577631848e+94
rra[3].cdp_prep[0].unknown_datapoints = 0


Yep, "e+94".  The above sample is the clock offset on my Linux desktop.
Similarly disk, inode, memory, users, etc.

This is also happening with homegrown tests.  For example, a script that
does this:

     /usr/bin/time -p openssl s_client -connect $COSERVER

to get the timing statistics for a connection.  It shows the same
ridiculously big numbers, but only for a few samples:

                        <!-- 2015-08-03 09:50:00 EDT / 1438609800 -->
<row><v> 1.2500000000e-02 </v><v> 1.0000000000e-02 </v><v> 0.0000000000e+00
</v></row>
                        <!-- 2015-08-03 09:55:00 EDT / 1438610100 -->
<row><v> 2.0411919169e+93 </v><v> 2.0411919169e+93 </v><v> 2.0411919169e+93
</v></row>
                        <!-- 2015-08-03 10:00:00 EDT / 1438610400 -->
<row><v> 2.0411919169e+93 </v><v> 2.0411919169e+93 </v><v> 2.0411919169e+93
</v></row>
                        <!-- 2015-08-03 10:05:00 EDT / 1438610700 -->
<row><v> 2.0411919169e+93 </v><v> 2.0411919169e+93 </v><v> 2.0411919169e+93
</v></row>
                        <!-- 2015-08-03 10:10:00 EDT / 1438611000 -->
<row><v> 5.6024046835e+89 </v><v> 5.6024046835e+89 </v><v> 5.6024046835e+89
</v></row>
                        <!-- 2015-08-03 10:15:00 EDT / 1438611300 -->
<row><v> 1.8600000000e-02 </v><v> 1.0000000000e-02 </v><v> 0.0000000000e+00
</v></row>
                        <!-- 2015-08-03 10:20:00 EDT / 1438611600 -->
<row><v> 2.0000000000e-02 </v><v> 1.0000000000e-02 </v><v> 0.0000000000e+00
</v></row>

I'm going to try the spike removal technique and see what happens.

I'm not getting alerts saying disks are umpteen bazillion % full, which is
good.  It also suggests the stupid numbers are creeping in somewhere in the
RRD backend.

I'm also getting graphs from one server showing up under another server.
I.e. on a disk page that shows just the standard df listing with /, /usr,
/var, /home, /tmp I'm seeing graphs for filesystems that exist on a
different machine.  I don't know if that's related though.

Ralph Mitchell
▸
On Fri, Jul 10, 2015 at 5:17 AM, Steve B <user-df463d3c0721@xymon.invalid> wrote:
It's pretty much all the graphs, GAUGE or not. We upgraded our rrdtool as
we were on an older version and it seemed ok for hours but then in the AM
there were some massive spikes and it has spread like wildfire and we are
back where we started.  Not all graphs are affected though. It seems random
but it's probably not.
Still looking at stats and graphs for the vm from inside and out. Very
frustrating all this!
Thanks

On Wed, Jul 8, 2015 at 3:14 AM, Jeremy Laidman <user-71895fb2e44c@xymon.invalid>
wrote:
On 7 July 2015 at 22:13, Steve B <user-df463d3c0721@xymon.invalid> wrote:ds[pct].min = 0.0000000000e+00 ds[pct].max = 1.0000000000e+02 ds[pct].last_ds = "89" ds[pct].value = 7.9210000000e+03Well, this is interesting. The "max" is set at 100%, but rrdtool accepted a value of 7921%. I've had this happen in the past, but haven't found the cause. I ended up doing an xport/edit/restore on each RRD file affected. However, it's only happened here and there. I've never seen a widespread problem across lots of graphs all at the same time. My first thought was a counter-wrap problem, but as I recall, I quickly eliminated that as a possible cause. Are all affected graphs of type GAUGE? J
list Steve B
In the end, and as you said earlier, it just went away by itself for our
setup as well. Well that's not really true but we noticed that some network
checks were creating a ridiculous amount of graphs - example: if_stat was
creating 30-40 graphs per host and we have say 300 hosts throughout the
world with that one check - it's just too much.  This coupled with a heck
of a lot of hosts overall (with graphs throughout) and Devmon+graphs was
the first place to tackle so we just turned off all rrd generation for
if_stat and after a restore of graphs data just before everything went
haywire, after a few days everything was ok again and that was over a month
ago now so it seems to have stabilised.  Still wondering what really
happened but I guess we may never know.

On Mon, Aug 3, 2015 at 6:56 PM, Ralph Mitchell <user-00a5e44c48c0@xymon.invalid>
▸
wrote:
I'm getting another set of massive spikes.  Everything that updated in the
last couple of days has this:

rra[3].cf = "AVERAGE"
rra[3].rows = 864
rra[3].pdp_per_row = 288
rra[3].xff = 5.0000000000e-01
rra[3].cdp_prep[0].value = 2.8577631848e+94
rra[3].cdp_prep[0].unknown_datapoints = 0


Yep, "e+94".  The above sample is the clock offset on my Linux desktop.
Similarly disk, inode, memory, users, etc.

This is also happening with homegrown tests.  For example, a script that
does this:

     /usr/bin/time -p openssl s_client -connect $COSERVER

to get the timing statistics for a connection.  It shows the same
ridiculously big numbers, but only for a few samples:

                        <!-- 2015-08-03 09:50:00 EDT / 1438609800 -->
<row><v> 1.2500000000e-02 </v><v> 1.0000000000e-02 </v><v> 0.0000000000e+00
</v></row>
                        <!-- 2015-08-03 09:55:00 EDT / 1438610100 -->
<row><v> 2.0411919169e+93 </v><v> 2.0411919169e+93 </v><v> 2.0411919169e+93
</v></row>
                        <!-- 2015-08-03 10:00:00 EDT / 1438610400 -->
<row><v> 2.0411919169e+93 </v><v> 2.0411919169e+93 </v><v> 2.0411919169e+93
</v></row>
                        <!-- 2015-08-03 10:05:00 EDT / 1438610700 -->
<row><v> 2.0411919169e+93 </v><v> 2.0411919169e+93 </v><v> 2.0411919169e+93
</v></row>
                        <!-- 2015-08-03 10:10:00 EDT / 1438611000 -->
<row><v> 5.6024046835e+89 </v><v> 5.6024046835e+89 </v><v> 5.6024046835e+89
</v></row>
                        <!-- 2015-08-03 10:15:00 EDT / 1438611300 -->
<row><v> 1.8600000000e-02 </v><v> 1.0000000000e-02 </v><v> 0.0000000000e+00
</v></row>
                        <!-- 2015-08-03 10:20:00 EDT / 1438611600 -->
<row><v> 2.0000000000e-02 </v><v> 1.0000000000e-02 </v><v> 0.0000000000e+00
</v></row>

I'm going to try the spike removal technique and see what happens.

I'm not getting alerts saying disks are umpteen bazillion % full, which is
good.  It also suggests the stupid numbers are creeping in somewhere in the
RRD backend.

I'm also getting graphs from one server showing up under another server.
I.e. on a disk page that shows just the standard df listing with /, /usr,
/var, /home, /tmp I'm seeing graphs for filesystems that exist on a
different machine.  I don't know if that's related though.

Ralph Mitchell


On Fri, Jul 10, 2015 at 5:17 AM, Steve B <user-df463d3c0721@xymon.invalid> wrote:
It's pretty much all the graphs, GAUGE or not. We upgraded our rrdtool as we were on an older version and it seemed ok for hours but then in the AM there were some massive spikes and it has spread like wildfire and we are back where we started. Not all graphs are affected though. It seems random but it's probably not. Still looking at stats and graphs for the vm from inside and out. Very frustrating all this! Thanks On Wed, Jul 8, 2015 at 3:14 AM, Jeremy Laidman <user-71895fb2e44c@xymon.invalid> wrote:On 7 July 2015 at 22:13, Steve B <user-df463d3c0721@xymon.invalid> wrote:ds[pct].min = 0.0000000000e+00 ds[pct].max = 1.0000000000e+02 ds[pct].last_ds = "89" ds[pct].value = 7.9210000000e+03Well, this is interesting. The "max" is set at 100%, but rrdtool accepted a value of 7921%. I've had this happen in the past, but haven't found the cause. I ended up doing an xport/edit/restore on each RRD file affected. However, it's only happened here and there. I've never seen a widespread problem across lots of graphs all at the same time. My first thought was a counter-wrap problem, but as I recall, I quickly eliminated that as a possible cause. Are all affected graphs of type GAUGE? J