strange rrd results via ncv
list Craig Whilding
We recently rolled out a sun grid engine platform and I'm now trying to
gather performance/usage information from it (if someone already has a
collection of scripts this would also help me immensely).
I've written a perl script that passes job queue information to hobbit
which outputs in the following format:
Running jobs : 7
Queued jobs : 0
Xfering jobs : 0
Errorstate jobs : 0
This should be ideal for ncv and I have therefore added ginfo=ncv to
TEST2RRD in hobbitserver.cfg as well as
NCV_qinfo="Runningjobs:GAUGE,Queuedjobs:GAUGE,Xferingjobs:GAUGE,Errorsta
tejobs:GAUGE" on its own line because this is fluctuating data and not a
counter.
The graph definition looks like this:
[qinfo]
TITLE Q Info
YAXIS Jobs
DEF:running=qinfo.rrd:Runningjobs:AVERAGE
DEF:queued=qinfo.rrd:Queuedjobs:AVERAGE
DEF:xfering=qinfo.rrd:Xferingjobs:AVERAGE
DEF:errorstate=qinfo.rrd:Errorstatejobs:AVERAGE
LINE2:running#0000FF:Running Jobs
LINE2:queued#00CC33:Queued Jobs
LINE2:xfering#FF0000:Xfering Jobs
LINE2:errorstate#FFFF00:Errorstate Jobs
COMMENT:\n
GPRINT:running:LAST:Running jobs \: %5.1lf%s (cur)
GPRINT:running:MAX: \: %5.1lf%s (max)
GPRINT:running:MIN: \: %5.1lf%s (min)
GPRINT:running:AVERAGE: \: %5.1lf%s (avg)\n
GPRINT:queued:LAST:Queued jobs \: %5.1lf%s (cur)
GPRINT:queued:MAX: \: %5.1lf%s (max)
GPRINT:queued:MIN: \: %5.1lf%s (min)
GPRINT:queued:AVERAGE: \: %5.1lf%s (avg)\n
GPRINT:xfering:LAST:Xfering jobs \: %5.1lf%s (cur)
GPRINT:xfering:MAX: \: %5.1lf%s (max)
GPRINT:xfering:MIN: \: %5.1lf%s (min)
GPRINT:xfering:AVERAGE: \: %5.1lf%s (avg)\n
GPRINT:errorstate:LAST:Errorstate jobs \: %5.1lf%s (cur)
GPRINT:errorstate:MAX: \: %5.1lf%s (max)
GPRINT:errorstate:MIN: \: %5.1lf%s (min)
GPRINT:errorstate:AVERAGE: \: %5.1lf%s (avg)\n
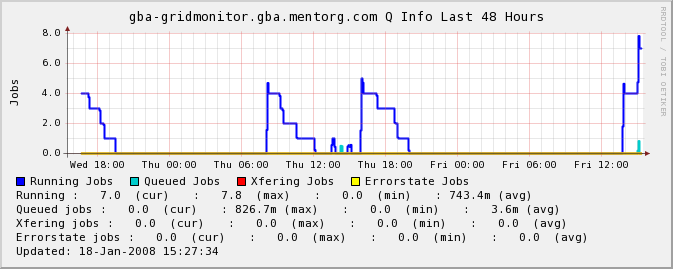
As you can see from the attached graph there are some rather strange
results coming out and the rrd file contains values such as 3.9/4.8 when
you really can't have .x of a job and the output from the script only
ever shows whole numbers as it should.
Thanks for any help with what's going wrong.
Regards,
Craig Whilding
IT Systems Contractor
Mentor Graphics
Attachments (1)
 attachment.png
list Gary Baluha
I ran into the same confusion myself at one point.  Remember that the values
on the RRD graph are 5 minute averaged values.  So if one minute there are 2
jobs running and the next there are 3, the 2-minute average is 2.5.  The
values do actually make sense when you look at the average value.

On Jan 18, 2008 10:39 AM, Whilding, Craig <
▸
user-878e45cf7965@xymon.invalid> wrote:
 We recently rolled out a sun grid engine platform and I'm now trying to
gather performance/usage information from it (if someone already has a
collection of scripts this would also help me immensely).


I've written a perl script that passes job queue information to hobbit
which outputs in the following format:


Running    jobs : 7

Queued     jobs : 0

Xfering    jobs : 0

Errorstate jobs : 0


This should be ideal for ncv and I have therefore added ginfo=ncv to
TEST2RRD in hobbitserver.cfg as well as
NCV_qinfo="Runningjobs:GAUGE,Queuedjobs:GAUGE,Xferingjobs:GAUGE,Errorstatejobs:GAUGE"
▸
on its own line because this is fluctuating data and not a counter.


The graph definition looks like this:

[qinfo]

        TITLE Q Info

        YAXIS Jobs

        DEF:running=qinfo.rrd:Runningjobs:AVERAGE

        DEF:queued=qinfo.rrd:Queuedjobs:AVERAGE

        DEF:xfering=qinfo.rrd:Xferingjobs:AVERAGE

        DEF:errorstate=qinfo.rrd:Errorstatejobs:AVERAGE

        LINE2:running#0000FF:Running Jobs

        LINE2:queued#00CC33:Queued Jobs

        LINE2:xfering#FF0000:Xfering Jobs

        LINE2:errorstate#FFFF00:Errorstate Jobs

        COMMENT:\n

        GPRINT:running:LAST:Running jobs \: %5.1lf%s (cur)

        GPRINT:running:MAX: \: %5.1lf%s (max)

        GPRINT:running:MIN: \: %5.1lf%s (min)

        GPRINT:running:AVERAGE: \: %5.1lf%s (avg)\n

        GPRINT:queued:LAST:Queued jobs \: %5.1lf%s (cur)

        GPRINT:queued:MAX: \: %5.1lf%s (max)

        GPRINT:queued:MIN: \: %5.1lf%s (min)

        GPRINT:queued:AVERAGE: \: %5.1lf%s (avg)\n

        GPRINT:xfering:LAST:Xfering jobs \: %5.1lf%s (cur)

        GPRINT:xfering:MAX: \: %5.1lf%s (max)

        GPRINT:xfering:MIN: \: %5.1lf%s (min)

        GPRINT:xfering:AVERAGE: \: %5.1lf%s (avg)\n

        GPRINT:errorstate:LAST:Errorstate jobs \: %5.1lf%s (cur)

        GPRINT:errorstate:MAX: \: %5.1lf%s (max)

        GPRINT:errorstate:MIN: \: %5.1lf%s (min)

        GPRINT:errorstate:AVERAGE: \: %5.1lf%s (avg)\n


As you can see from the attached graph there are some rather strange
results coming out and the rrd file contains values such as 3.9/4.8 when
you really can't have .x of a job and the output from the script only ever
shows whole numbers as it should.


Thanks for any help with what's going wrong.


Regards,

Craig Whilding

IT Systems Contractor

Mentor Graphics
list Craig Whilding
I've had to reply to myself as hobbit mail isn't getting through to me
for some reason.


Gary or others do you know how I can get it to chart the exact vale that
comes in then. It's a bit silly having a graph of 4.8 jobs etc. Also 4.5
is the average of 4 and 5 so it doesn't make much sense anyway, Also
it's the data at the bottom of the graph that is really odd - queue max
= 1.5m, running average 445.0m?


Not sure where that data is coming from?


Thanks,

Craig
▸
From: Whilding, Craig
Sent: 18 January 2008 15:39
To: 'user-ae9b8668bcde@xymon.invalid'
Subject: strange rrd results via ncv


We recently rolled out a sun grid engine platform and I'm now trying to
gather performance/usage information from it (if someone already has a
collection of scripts this would also help me immensely).


I've written a perl script that passes job queue information to hobbit
which outputs in the following format:


Running    jobs : 7
Queued     jobs : 0
Xfering    jobs : 0
Errorstate jobs : 0


This should be ideal for ncv and I have therefore added ginfo=ncv to
TEST2RRD in hobbitserver.cfg as well as
NCV_qinfo="Runningjobs:GAUGE,Queuedjobs:GAUGE,Xferingjobs:GAUGE,Errorsta
tejobs:GAUGE" on its own line because this is fluctuating data and not a
counter.


The graph definition looks like this:

[qinfo]

        TITLE Q Info

        YAXIS Jobs

        DEF:running=qinfo.rrd:Runningjobs:AVERAGE

        DEF:queued=qinfo.rrd:Queuedjobs:AVERAGE

        DEF:xfering=qinfo.rrd:Xferingjobs:AVERAGE

        DEF:errorstate=qinfo.rrd:Errorstatejobs:AVERAGE

        LINE2:running#0000FF:Running Jobs

        LINE2:queued#00CC33:Queued Jobs

        LINE2:xfering#FF0000:Xfering Jobs

        LINE2:errorstate#FFFF00:Errorstate Jobs

        COMMENT:\n

        GPRINT:running:LAST:Running jobs \: %5.1lf%s (cur)

        GPRINT:running:MAX: \: %5.1lf%s (max)

        GPRINT:running:MIN: \: %5.1lf%s (min)

        GPRINT:running:AVERAGE: \: %5.1lf%s (avg)\n

        GPRINT:queued:LAST:Queued jobs \: %5.1lf%s (cur)

        GPRINT:queued:MAX: \: %5.1lf%s (max)

        GPRINT:queued:MIN: \: %5.1lf%s (min)

        GPRINT:queued:AVERAGE: \: %5.1lf%s (avg)\n

        GPRINT:xfering:LAST:Xfering jobs \: %5.1lf%s (cur)

        GPRINT:xfering:MAX: \: %5.1lf%s (max)

        GPRINT:xfering:MIN: \: %5.1lf%s (min)

        GPRINT:xfering:AVERAGE: \: %5.1lf%s (avg)\n

        GPRINT:errorstate:LAST:Errorstate jobs \: %5.1lf%s (cur)

        GPRINT:errorstate:MAX: \: %5.1lf%s (max)

        GPRINT:errorstate:MIN: \: %5.1lf%s (min)

        GPRINT:errorstate:AVERAGE: \: %5.1lf%s (avg)\n


As you can see from the attached graph there are some rather strange
results coming out and the rrd file contains values such as 3.9/4.8 when
you really can't have .x of a job and the output from the script only
ever shows whole numbers as it should.


Thanks for any help with what's going wrong.


Regards,

Craig Whilding

IT Systems Contractor

Mentor Graphics
list Ralph Mitchell
On Jan 21, 2008 4:09 AM, Whilding, Craig <
▸
user-878e45cf7965@xymon.invalid> wrote:
 I've had to reply to myself as hobbit mail isn't getting through to me
for some reason.


Gary or others do you know how I can get it to chart the exact vale that
comes in then. It's a bit silly having a graph of 4.8 jobs etc. Also 4.5is the average of 4 and 5 so it doesn't make much sense anyway, Also it's
▸
the data at the bottom of the graph that is really odd – queue max = 1.5m,
running average 445.0m?


Not sure where that data is coming from?
The problem is that rrdtool expects data to arrive at specific intervals.
Any data that doesn't arrive at the precise time it should, gets
interpolated - i.e. "adjusted to fit the curve".  So, if the rrd is built
with a start time of midnight and update intervals of 300 seconds (5
minutes), you'd need to be delivering updates at 00:05, 00:10, 00:15, etc,
in order to get the exact values stored.

You'll see this in some of the standard graphs too.  I have a machine that's
recording network traffic and right now its current bits-per-second value on
the graph is 15247.9.  0.9 of a bit is ridiculous, but there it is...

Ralph Mitchell