Monitor Solaris zone from Shire
list Martin Flemming
Hi and happy new year afterwards ! :-)
I've got a problem with the monitor's script from Shire
mpstat and zonestat .. maybe basicly :-(
I take it, that i've had to run concorruntley both (?!) on the
global-zone, nothing more on client-side ...
On the Hobbit-Server i've to change
a)
hobbitlaunch.cfg
[rrddata]
ENVFILE /home/hobbit/server/etc/hobbitserver.cfg
NEEDS hobbitd
CMD hobbitd_channel --channel=data
--log=$BBSERVERLOGS/rrd-data.log hobbitd_rrd
--extra-tests=mpstat,zonestat
--extra-script=/home/hobbit/server/ext/rrd_data.pl
--rrddir=$BBVAR/rrd
b)
hobbitgraph.cfg :
the entries for
mpstatusr|mpstatsys|mpstatwt|mpstatidl
zonestatcpu|zonestatmem|zonestatnproc|zonestatsize|zonersssize
c)
further ext-script
rrd_data.pl
d)
In the opposite of the webside, i've changed the entry in bb-hosts
from
0.0.0.0 myserver # zonestat:zonestatcpu|zonestatmem|zonestatnproc|zonestatsize|zonersssize
to
real.IP-Number myserver # TRENDS:*,zonestat:zonestatcpu|zonestatmem|zonestatnproc|zonestatsize|zonersssize,mpstat:mpstatusr|mpstatsys|mpstatwt|mpstatid
.. because i've got a second entry of the same type but nothing more ...
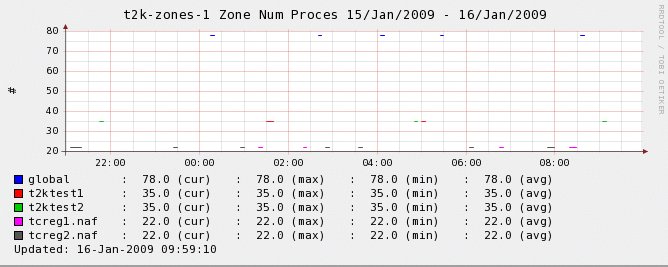
The trend-graph's of zonestatcpu etc. ... are very strange, because
the curves (entries/values) were n't curves insteed they are scattered, ..
a jpeg is attachment by that mail ...
.. also the mpstat-graphs for each CPU (32) .. ..
The Hardware is a SPARC-Enterprise-T2000 and the running OS the global-machine
is SunOS 5.10 Generic_120011-14 sparc.
Any hints ?
thanks & cheers,
martin
Attachments (1)
 attachment.jpeg
list Galen Johnson
Based on the graph, it's "scattered" because it isn't getting consistent data input. I'd be willing to bet if you did a dump of the rrd file you'd see many Nan (Not a number) responses.

=G=
▸
-----Original Message-----
From: Martin Flemming [mailto:user-f286aaa49a76@xymon.invalid]
Sent: Friday, January 16, 2009 11:43 AM
To: user-ae9b8668bcde@xymon.invalid
Subject: [hobbit] Monitor Solaris zone from Shire


Hi and happy new year afterwards ! :-)

I've got a problem with the monitor's script from Shire
mpstat and zonestat .. maybe basicly :-(

I take it, that i've had to run concorruntley both (?!) on the
global-zone, nothing more on client-side ...

On the Hobbit-Server i've to change

a)
hobbitlaunch.cfg

[rrddata]
     ENVFILE /home/hobbit/server/etc/hobbitserver.cfg
     NEEDS hobbitd
     CMD hobbitd_channel --channel=data
            --log=$BBSERVERLOGS/rrd-data.log hobbitd_rrd
            --extra-tests=mpstat,zonestat
            --extra-script=/home/hobbit/server/ext/rrd_data.pl
            --rrddir=$BBVAR/rrd

b)
hobbitgraph.cfg :

the entries for

mpstatusr|mpstatsys|mpstatwt|mpstatidl
zonestatcpu|zonestatmem|zonestatnproc|zonestatsize|zonersssize

c)
further ext-script

rrd_data.pl

d)
In the opposite of the webside, i've changed the entry in bb-hosts

from

0.0.0.0   myserver    # zonestat:zonestatcpu|zonestatmem|zonestatnproc|zonestatsize|zonersssize

to

real.IP-Number myserver # TRENDS:*,zonestat:zonestatcpu|zonestatmem|zonestatnproc|zonestatsize|zonersssize,mpstat:mpstatusr|mpstatsys|mpstatwt|mpstatid

.. because i've got a second entry of the same type but nothing more ...

The trend-graph's of zonestatcpu etc. ... are very strange, because
the curves (entries/values) were n't curves insteed they  are scattered, ..
a jpeg is attachment by that mail ...

.. also the mpstat-graphs for each CPU (32) .. ..

The Hardware is a SPARC-Enterprise-T2000 and the running OS the global-machine
is SunOS  5.10 Generic_120011-14 sparc.

Any hints ?

thanks & cheers,

        martin
list Martin Flemming
Yep, i've believe it too,
and your right ... many NaN's in there ...
The questions is why is flapping,
i thought i've configured false or misunderstood somethings of these
scripts ..
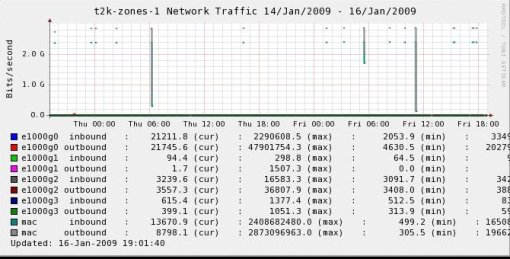
.. as attachment the network-graph ...
But you mean, it's more possible to be a hardware/configuration-problem
and not a hobbit-problem .. ?
thanks & cheers
martin
P.S.:
I've got another hobbit-server,
which get all default-information from the global-zone-machine,
but no mtstat-rrd's or zonstat-rrd are to see ? !
▸
On Fri, 16 Jan 2009, Galen Johnson wrote:
Based on the graph, it's "scattered" because it isn't getting consistent data input. I'd be willing to bet if you did a dump of the rrd file you'd see many Nan (Not a number) responses.

=G=

-----Original Message-----
From: Martin Flemming [mailto:user-f286aaa49a76@xymon.invalid]
Sent: Friday, January 16, 2009 11:43 AM
To: user-ae9b8668bcde@xymon.invalid
Subject: [hobbit] Monitor Solaris zone from Shire


Hi and happy new year afterwards ! :-)

I've got a problem with the monitor's script from Shire
mpstat and zonestat .. maybe basicly :-(

I take it, that i've had to run concorruntley both (?!) on the
global-zone, nothing more on client-side ...

On the Hobbit-Server i've to change

a)
hobbitlaunch.cfg

[rrddata]
    ENVFILE /home/hobbit/server/etc/hobbitserver.cfg
    NEEDS hobbitd
    CMD hobbitd_channel --channel=data
           --log=$BBSERVERLOGS/rrd-data.log hobbitd_rrd
           --extra-tests=mpstat,zonestat
           --extra-script=/home/hobbit/server/ext/rrd_data.pl
           --rrddir=$BBVAR/rrd

b)
hobbitgraph.cfg :

the entries for

mpstatusr|mpstatsys|mpstatwt|mpstatidl
zonestatcpu|zonestatmem|zonestatnproc|zonestatsize|zonersssize

c)
further ext-script

rrd_data.pl

d)
In the opposite of the webside, i've changed the entry in bb-hosts

from

0.0.0.0   myserver    # zonestat:zonestatcpu|zonestatmem|zonestatnproc|zonestatsize|zonersssize

to

real.IP-Number myserver # TRENDS:*,zonestat:zonestatcpu|zonestatmem|zonestatnproc|zonestatsize|zonersssize,mpstat:mpstatusr|mpstatsys|mpstatwt|mpstatid

.. because i've got a second entry of the same type but nothing more ...

The trend-graph's of zonestatcpu etc. ... are very strange, because
the curves (entries/values) were n't curves insteed they  are scattered, ..
a jpeg is attachment by that mail ...

.. also the mpstat-graphs for each CPU (32) .. ..

The Hardware is a SPARC-Enterprise-T2000 and the running OS the global-machine
is SunOS  5.10 Generic_120011-14 sparc.

Any hints ?

thanks & cheers,

       martin
Attachments (1)
 attachment.jpeg
list Martin Flemming
By the way, on the zones are running hobbit-clients
and there is nothing unusual ...

martin
▸
On Fri, 16 Jan 2009, Martin Flemming wrote:
Yep, i've believe it too,
and your right ... many NaN's in there ...

The questions is why is flapping,
i thought i've configured false or misunderstood somethings of these scripts
..

.. as attachment the network-graph ...

But you mean, it's more possible to be a hardware/configuration-problem
and not a hobbit-problem .. ?

thanks & cheers

       martin

P.S.:
I've got another hobbit-server,
which get all default-information from the global-zone-machine,
but no mtstat-rrd's or zonstat-rrd are to see ? !


On Fri, 16 Jan 2009, Galen Johnson wrote:
Based on the graph, it's "scattered" because it isn't getting consistent data input. I'd be willing to bet if you did a dump of the rrd file you'd see many Nan (Not a number) responses. =G= -----Original Message----- From: Martin Flemming [mailto:user-f286aaa49a76@xymon.invalid] Sent: Friday, January 16, 2009 11:43 AM To: user-ae9b8668bcde@xymon.invalid Subject: [hobbit] Monitor Solaris zone from Shire Hi and happy new year afterwards ! :-) I've got a problem with the monitor's script from Shire mpstat and zonestat .. maybe basicly :-( I take it, that i've had to run concorruntley both (?!) on the global-zone, nothing more on client-side ... On the Hobbit-Server i've to change a) hobbitlaunch.cfg [rrddata] ENVFILE /home/hobbit/server/etc/hobbitserver.cfg NEEDS hobbitd CMD hobbitd_channel --channel=data --log=$BBSERVERLOGS/rrd-data.log hobbitd_rrd --extra-tests=mpstat,zonestat --extra-script=/home/hobbit/server/ext/rrd_data.pl --rrddir=$BBVAR/rrd b) hobbitgraph.cfg : the entries for mpstatusr|mpstatsys|mpstatwt|mpstatidl zonestatcpu|zonestatmem|zonestatnproc|zonestatsize|zonersssize c) further ext-script rrd_data.pl d) In the opposite of the webside, i've changed the entry in bb-hosts from 0.0.0.0 myserver # zonestat:zonestatcpu|zonestatmem|zonestatnproc|zonestatsize|zonersssize to real.IP-Number myserver # TRENDS:*,zonestat:zonestatcpu|zonestatmem|zonestatnproc|zonestatsize|zonersssize,mpstat:mpstatusr|mpstatsys|mpstatwt|mpstatid .. because i've got a second entry of the same type but nothing more ... The trend-graph's of zonestatcpu etc. ... are very strange, because the curves (entries/values) were n't curves insteed they are scattered, .. a jpeg is attachment by that mail ... .. also the mpstat-graphs for each CPU (32) .. .. The Hardware is a SPARC-Enterprise-T2000 and the running OS the global-machine is SunOS 5.10 Generic_120011-14 sparc. Any hints ? thanks & cheers, martin
Gruss

        Martin Flemming


Martin Flemming
DESY / IT          office : Building 2b / 008a
Notkestr. 85       phone  : XXX - XXXX - XXXX
22603 Hamburg      mail   : user-f286aaa49a76@xymon.invalid
list Galen Johnson
You may want to try running the commands the scripts use by hand and see what they return.
▸
=G=

-----Original Message-----
From: Martin Flemming [mailto:user-f286aaa49a76@xymon.invalid]
Sent: Friday, January 16, 2009 2:12 PM
To: user-ae9b8668bcde@xymon.invalid
Subject: RE: [hobbit] Monitor Solaris zone from Shire


By the way, on the zones are running hobbit-clients
and there is nothing unusual ...

martin

On Fri, 16 Jan 2009, Martin Flemming wrote:
Yep, i've believe it too,
and your right ... many NaN's in there ...

The questions is why is flapping,
i thought i've configured false or misunderstood somethings of these scripts
..

.. as attachment the network-graph ...

But you mean, it's more possible to be a hardware/configuration-problem
and not a hobbit-problem .. ?

thanks & cheers

       martin

P.S.:
I've got another hobbit-server,
which get all default-information from the global-zone-machine,
but no mtstat-rrd's or zonstat-rrd are to see ? !


On Fri, 16 Jan 2009, Galen Johnson wrote:
Based on the graph, it's "scattered" because it isn't getting consistent data input. I'd be willing to bet if you did a dump of the rrd file you'd see many Nan (Not a number) responses. =G= -----Original Message----- From: Martin Flemming [mailto:user-f286aaa49a76@xymon.invalid] Sent: Friday, January 16, 2009 11:43 AM To: user-ae9b8668bcde@xymon.invalid Subject: [hobbit] Monitor Solaris zone from Shire Hi and happy new year afterwards ! :-) I've got a problem with the monitor's script from Shire mpstat and zonestat .. maybe basicly :-( I take it, that i've had to run concorruntley both (?!) on the global-zone, nothing more on client-side ... On the Hobbit-Server i've to change a) hobbitlaunch.cfg [rrddata] ENVFILE /home/hobbit/server/etc/hobbitserver.cfg NEEDS hobbitd CMD hobbitd_channel --channel=data --log=$BBSERVERLOGS/rrd-data.log hobbitd_rrd --extra-tests=mpstat,zonestat --extra-script=/home/hobbit/server/ext/rrd_data.pl --rrddir=$BBVAR/rrd b) hobbitgraph.cfg : the entries for mpstatusr|mpstatsys|mpstatwt|mpstatidl zonestatcpu|zonestatmem|zonestatnproc|zonestatsize|zonersssize c) further ext-script rrd_data.pl d) In the opposite of the webside, i've changed the entry in bb-hosts from 0.0.0.0 myserver # zonestat:zonestatcpu|zonestatmem|zonestatnproc|zonestatsize|zonersssize to real.IP-Number myserver # TRENDS:*,zonestat:zonestatcpu|zonestatmem|zonestatnproc|zonestatsize|zonersssize,mpstat:mpstatusr|mpstatsys|mpstatwt|mpstatid .. because i've got a second entry of the same type but nothing more ... The trend-graph's of zonestatcpu etc. ... are very strange, because the curves (entries/values) were n't curves insteed they are scattered, .. a jpeg is attachment by that mail ... .. also the mpstat-graphs for each CPU (32) .. .. The Hardware is a SPARC-Enterprise-T2000 and the running OS the global-machine is SunOS 5.10 Generic_120011-14 sparc. Any hints ? thanks & cheers, martin
Gruss

        Martin Flemming


Martin Flemming
DESY / IT          office : Building 2b / 008a
Notkestr. 85       phone  : XXX - XXXX - XXXX
22603 Hamburg      mail   : user-f286aaa49a76@xymon.invalid
list Martin Flemming
In the zonestat.log
(after setting 'set -x' in the zonststat.sh)

i can read at the end :

+ /usr/bin/cat /opt/csw/libexec/hobbit/client/tmp/hobbit_zonestat.t2k-zones-1.send
+ /opt/csw/libexec/hobbit/client/bin/bb 0.0.0.0 data t2k-zones-1.zonestat

ZONEs: global t2ktest2 t2ktest1 tcreg2.naf tcreg1.naf
tcreg1.nafnproc: 22
tcreg1.nafsize: 261
tcreg1.nafrss: 320
tcreg1.nafmemory: 3.9
tcreg1.nafcpu: 1.3
tcreg2.nafnproc: 22
tcreg2.nafsize: 923
tcreg2.nafrss: 934
tcreg2.nafmemory: 11
tcreg2.nafcpu: 0.1
t2ktest1nproc: 35
t2ktest1size: 992
t2ktest1rss: 1002
t2ktest1memory: 12
t2ktest1cpu: 0.1
t2ktest2nproc: 35
t2ktest2size: 1046
t2ktest2rss: 1177
t2ktest2memory: 14
t2ktest2cpu: 0.0
globalnproc: 105
globalsize: 814
globalrss: 816
globalmemory: 10
globalcpu: 0.0

(bb 0.0.0.0 because the client should send his data to 3 hobbit-server)

So, every data will be send, also the server got's the data,
if i capture on the server

/usr/lib/hobbit/server/bin/bbcmd hobbitd_channel --debug --channel=data hobbitd_capture --hosts=t2k-zones-1

data t2k-zones-1.zonestat

ZONEs: global t2ktest2 t2ktest1 tcreg2.naf tcreg1.naf
tcreg1.nafnproc: 22
tcreg1.nafsize: 262
tcreg1.nafrss: 320
tcreg1.nafmemory: 3.9
tcreg1.nafcpu: 1.7
t2ktest1nproc: 35
t2ktest1size: 992
t2ktest1rss: 1002
t2ktest1memory: 12
t2ktest1cpu: 0.1
tcreg2.nafnproc: 22
tcreg2.nafsize: 923
tcreg2.nafrss: 934
tcreg2.nafmemory: 11
tcreg2.nafcpu: 0.1
globalnproc: 104
globalsize: 813
globalrss: 815
globalmemory: 10
globalcpu: 0.0
t2ktest2nproc: 35
t2ktest2size: 1046
t2ktest2rss: 1177
t2ktest2memory: 14


but in the graphs i can't see full lines but single strokes ..
  periodly from the zone to zone .. very corious ..

Two of the host (t2ktest1,t2ktest2) are in the same domain like the
global-zone-host (t2k-zones-1) and the other are in one subdomain
(tcreg1.naf,tcreg2.naf) ... maybe a hint ..

thanks
▸
 	martin


On Fri, 16 Jan 2009, Galen Johnson wrote:
You may want to try running the commands the scripts use by hand and see what they return.

=G=

-----Original Message-----
From: Martin Flemming [mailto:user-f286aaa49a76@xymon.invalid]
Sent: Friday, January 16, 2009 2:12 PM
To: user-ae9b8668bcde@xymon.invalid
Subject: RE: [hobbit] Monitor Solaris zone from Shire


By the way, on the zones are running hobbit-clients
and there is nothing unusual ...

martin

On Fri, 16 Jan 2009, Martin Flemming wrote:
Yep, i've believe it too, and your right ... many NaN's in there ... The questions is why is flapping, i thought i've configured false or misunderstood somethings of these scripts .. .. as attachment the network-graph ... But you mean, it's more possible to be a hardware/configuration-problem and not a hobbit-problem .. ? thanks & cheers martin P.S.: I've got another hobbit-server, which get all default-information from the global-zone-machine, but no mtstat-rrd's or zonstat-rrd are to see ? ! On Fri, 16 Jan 2009, Galen Johnson wrote:Based on the graph, it's "scattered" because it isn't getting consistent data input. I'd be willing to bet if you did a dump of the rrd file you'd see many Nan (Not a number) responses. =G= -----Original Message----- From: Martin Flemming [mailto:user-f286aaa49a76@xymon.invalid] Sent: Friday, January 16, 2009 11:43 AM To: user-ae9b8668bcde@xymon.invalid Subject: [hobbit] Monitor Solaris zone from Shire Hi and happy new year afterwards ! :-) I've got a problem with the monitor's script from Shire mpstat and zonestat .. maybe basicly :-( I take it, that i've had to run concorruntley both (?!) on the global-zone, nothing more on client-side ... On the Hobbit-Server i've to change a) hobbitlaunch.cfg [rrddata] ENVFILE /home/hobbit/server/etc/hobbitserver.cfg NEEDS hobbitd CMD hobbitd_channel --channel=data --log=$BBSERVERLOGS/rrd-data.log hobbitd_rrd --extra-tests=mpstat,zonestat --extra-script=/home/hobbit/server/ext/rrd_data.pl --rrddir=$BBVAR/rrd b) hobbitgraph.cfg : the entries for mpstatusr|mpstatsys|mpstatwt|mpstatidl zonestatcpu|zonestatmem|zonestatnproc|zonestatsize|zonersssize c) further ext-script rrd_data.pl d) In the opposite of the webside, i've changed the entry in bb-hosts from 0.0.0.0 myserver # zonestat:zonestatcpu|zonestatmem|zonestatnproc|zonestatsize|zonersssize to real.IP-Number myserver # TRENDS:*,zonestat:zonestatcpu|zonestatmem|zonestatnproc|zonestatsize|zonersssize,mpstat:mpstatusr|mpstatsys|mpstatwt|mpstatid .. because i've got a second entry of the same type but nothing more ... The trend-graph's of zonestatcpu etc. ... are very strange, because the curves (entries/values) were n't curves insteed they are scattered, .. a jpeg is attachment by that mail ... .. also the mpstat-graphs for each CPU (32) .. .. The Hardware is a SPARC-Enterprise-T2000 and the running OS the global-machine is SunOS 5.10 Generic_120011-14 sparc. Any hints ? thanks & cheers, martinGruss Martin Flemming Martin Flemming DESY / IT office : Building 2b / 008a Notkestr. 85 phone : XXX - XXXX - XXXX 22603 Hamburg mail : user-f286aaa49a76@xymon.invalid