Zoom graph scaling
list Charles Jones
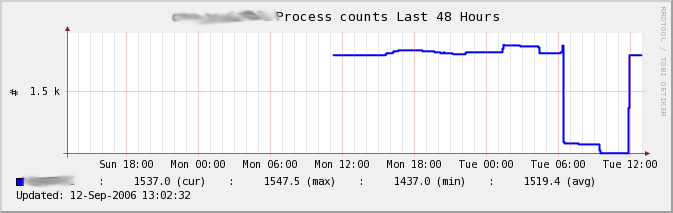
I have activated process graphing (via TRACK feature), but am having a problem where when a graph has a sudden decrease (see attached image), it is difficult to tell with any accuracy what the number of processes were. When I zoom in on the trough area, the scale remains unchanged (still just has a single value of 1.5k). Is there any setting I can tweak so that there are more indicators on the side of the graph, or that when you zoom in on a graph the Y axis also scales accordingly?

-Charles
Attachments (1)
 attachment.png