"virtual hosts" for combined graphs?
list Walter van Loon
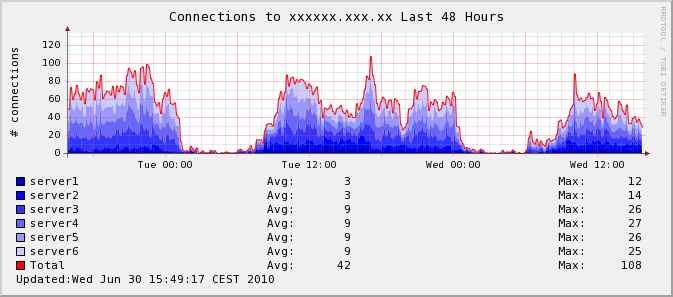
I created a small script that scrapes info from several hosts/rrd's
(connections to a particular IIS site) and puts it in a combined graph
(see attached sample). I'm curious if it's possible to somehow create a
"virtual host" in hobbit and use the hobbitgraph.cgi functions to create
the graphs so I can also have the zoom & history functions.

This is the script that created the attached graph:

#!/bin/bash

timestamp=COMMENT:Updated\\:`date|sed 's/:/\\\\:/g'`

rrdtool graph combined.png \
--imgformat=PNG \
--title="Connections to xxxxxx.xxx.xx Last 48 Hours" \
--base=1000 \
--height=120 \
--width=576 \
-s e-48h \
--slope-mode \
--lower-limit=0 \
--vertical-label="# connections" \
--step 576 \
'DEF:a=/var/lib/hobbit/rrd/server1/iisinfo.online.han.nl.rrd:realmempct:AVERAGE'
\
'AREA:a#0000CC:server1\t'  \
'GPRINT:a:AVERAGE:Avg\: %7.0lf %s\t'  \
'GPRINT:a:MAX:Max\: %7.0lf %s\j'  \
'DEF:b=/var/lib/hobbit/rrd/server2/iisinfo.online.han.nl.rrd:realmempct:AVERAGE'
\
'STACK:b#0000FF:server2\t'  \
'GPRINT:b:AVERAGE:Avg\: %7.0lf %s\t'  \
'GPRINT:b:MAX:Max\: %7.0lf %s\j'  \
'DEF:c=/var/lib/hobbit/rrd/server3/iisinfo.online.han.nl.rrd:realmempct:AVERAGE'
\
'STACK:c#3333FF:server3\t'  \
'GPRINT:c:AVERAGE:Avg\: %7.0lf %s\t'  \
'GPRINT:c:MAX:Max\: %7.0lf %s\j' \
'DEF:d=/var/lib/hobbit/rrd/server4/iisinfo.online.han.nl.rrd:realmempct:AVERAGE'
\
'STACK:d#6666FF:server4\t'  \
'GPRINT:d:AVERAGE:Avg\: %7.0lf %s\t'  \
'GPRINT:d:MAX:Max\: %7.0lf %s\j' \
'DEF:e=/var/lib/hobbit/rrd/server5/iisinfo.online.han.nl.rrd:realmempct:AVERAGE'
\
'STACK:e#9999FF:server5\t'  \
'GPRINT:e:AVERAGE:Avg\: %7.0lf %s\t'  \
'GPRINT:e:MAX:Max\: %7.0lf %s\j' \
'DEF:f=/var/lib/hobbit/rrd/server6/iisinfo.online.han.nl.rrd:realmempct:AVERAGE'
\
'STACK:f#CCCCFF:server6\t'  \
'GPRINT:f:AVERAGE:Avg\: %7.0lf %s\t'  \
'GPRINT:f:MAX:Max\: %7.0lf %s\j' \
'CDEF:total=a,b,+,c,+,d,+,e,+,f,+' \
'LINE1:total#FF0000:Total\t' \
'GPRINT:total:AVERAGE:Avg\: %7.0lf %s\t' \
'GPRINT:total:MAX:Max\: %7.0lf %s\j'  \
"$timestamp"
Attachments (1)
 attachment.jpg
list Ralph Mitchell
I think you should be able to put the graph definition into
server/etc/hobbitgraph.cfg with a suitable name, then put that name into
both the "TEST2RRD" & "GRAPHS" environment variables in
server/etc/hobbitserver.cfg.  Then send a suitable status message to xymon
and the graph shows up.

I've just tried this on my laptop:  mash two existing graph definitions
together (cpu freq and battery capacity) into one called "batfreq".  Add
"batfreq" to "TEST2RRD" & "GRAPHS".  Send test message:

     server/bin/bb localhost "status lorien.batfreq green `date`"

A short time later a new column shows up called batfreq.  Clicking through
thre green dot shows a single graph containing both battery capacity and 2
cpu frequency lines (dual-core cpu).

In your case, I think you might be able to get the combined graph to show up
for each server by sending multiple status messages:

     server/bin/bb localhost "status server1.xxx green `date`"
     server/bin/bb localhost "status server2.xxx green `date`"
     etc...

all from one script.  Or just define a new server name in bb-hosts and send
one message.  Either way, you'll probably want to have a regular status
message going to Xymon so that the new column doesn't go purple.

Ralph Mitchell


On Wed, Jun 30, 2010 at 10:00 AM, Walter van Loon <
▸
user-1451852d21c5@xymon.invalid> wrote:
I created a small script that scrapes info from several hosts/rrd's
(connections to a particular IIS site) and puts it in a combined graph
(see attached sample). I'm curious if it's possible to somehow create a
"virtual host" in hobbit and use the hobbitgraph.cgi functions to create
the graphs so I can also have the zoom & history functions.

This is the script that created the attached graph:

#!/bin/bash

timestamp=COMMENT:Updated\\:`date|sed 's/:/\\\\:/g'`

rrdtool graph combined.png \
--imgformat=PNG \
--title="Connections to xxxxxx.xxx.xx Last 48 Hours" \
--base=1000 \
--height=120 \
--width=576 \
-s e-48h \
--slope-mode \
--lower-limit=0 \
--vertical-label="# connections" \
--step 576 \

'DEF:a=/var/lib/hobbit/rrd/server1/iisinfo.online.han.nl.rrd:realmempct:AVERAGE'
\
'AREA:a#0000CC:server1\t'  \
'GPRINT:a:AVERAGE:Avg\: %7.0lf %s\t'  \
'GPRINT:a:MAX:Max\: %7.0lf %s\j'  \

'DEF:b=/var/lib/hobbit/rrd/server2/iisinfo.online.han.nl.rrd:realmempct:AVERAGE'
\
'STACK:b#0000FF:server2\t'  \
'GPRINT:b:AVERAGE:Avg\: %7.0lf %s\t'  \
'GPRINT:b:MAX:Max\: %7.0lf %s\j'  \

'DEF:c=/var/lib/hobbit/rrd/server3/iisinfo.online.han.nl.rrd:realmempct:AVERAGE'
\
'STACK:c#3333FF:server3\t'  \
'GPRINT:c:AVERAGE:Avg\: %7.0lf %s\t'  \
'GPRINT:c:MAX:Max\: %7.0lf %s\j' \

'DEF:d=/var/lib/hobbit/rrd/server4/iisinfo.online.han.nl.rrd:realmempct:AVERAGE'
\
'STACK:d#6666FF:server4\t'  \
'GPRINT:d:AVERAGE:Avg\: %7.0lf %s\t'  \
'GPRINT:d:MAX:Max\: %7.0lf %s\j' \

'DEF:e=/var/lib/hobbit/rrd/server5/iisinfo.online.han.nl.rrd:realmempct:AVERAGE'
\
'STACK:e#9999FF:server5\t'  \
'GPRINT:e:AVERAGE:Avg\: %7.0lf %s\t'  \
'GPRINT:e:MAX:Max\: %7.0lf %s\j' \

'DEF:f=/var/lib/hobbit/rrd/server6/iisinfo.online.han.nl.rrd:realmempct:AVERAGE'
\
'STACK:f#CCCCFF:server6\t'  \
'GPRINT:f:AVERAGE:Avg\: %7.0lf %s\t'  \
'GPRINT:f:MAX:Max\: %7.0lf %s\j' \
'CDEF:total=a,b,+,c,+,d,+,e,+,f,+' \
'LINE1:total#FF0000:Total\t' \
'GPRINT:total:AVERAGE:Avg\: %7.0lf %s\t' \
'GPRINT:total:MAX:Max\: %7.0lf %s\j'  \
"$timestamp"