little explanation of conn test.
list Randall Badilla Castro
Hi guys:
We are getting this graph from a webserver and the boos want a deeper explanation of it.

So AFAIK the conn test is a ping; so it will give and idea of how network is working and also can reflect how the server is performing serving request. (Note aside: I feel that TCP connection times from a ping test can be misleading, I mean ping is icmp which people calls 3.5 layer ).


--

CONFIDENCIALIDAD - La información contenida en este mensaje es confidencial y se dirige únicamente a su destinatario. Si usted lector de este mensaje no es ese destinatario, la diseminación, distribución o copia del mismo o sus adjuntos (de existir) se encuentran prohibidos. Si lo ha recibido por error, por favor notifique de manera inmediata por correo y destruya las copias de su correo.
CONFIDENTIALITY STATEMENT - The information contained in this message is confidential and intended only for the addressee. If the reader of this message is not the intended recipient you are notified that any dissemination, distribution or copy of this message and attachments (if any) is strictly prohibited. If you have received this in error, please immediately notify us by reply email, destroy all copies and remove from all media.
Attachments (1)
 attachment.png
list John Thurston
▸
On 1/25/2016 12:13 PM, Randall Badilla Castro wrote:
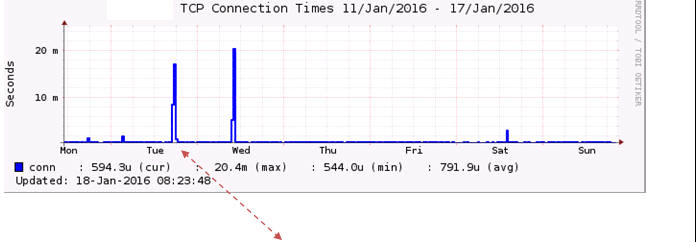
Hi guys:
We are getting this graph from a webserver and the boos want a deeper
explanation of it.
There isn't much to explain. As you have figured out, the "conn" test is an ICMP ECHO. The time plotted on this chart is how long it took for the ECHO request/response to make the round-trip. The end-points of the round trip are imprecise. On some systems, the hardware on the NIC will respond to an ECHO request. In other cases, the driver between the NIC and OS will respond. In other cases, the response may come from the operating system. Also hidden from this chart is the path the request/return traveled across the network.

The bumps on your chart, by themselves, mean nothing. "Something" made these two round trips take longer than usual. You have no way to know what or where.

The "conn" chart is valuable for only a couple of things:
   Is the host's NIC kinda-sorta alive?
   Is there a pattern of latency or loss?

Trying to extract more information from the "conn" test or chart is a fool's errand.
--
    Do things because you should, not just because you can.

John Thurston    XXX-XXX-XXXX
user-ce4d79d99bab@xymon.invalid
Enterprise Technology Services
Department of Administration
State of Alaska
list Randall Badilla Castro
▸
Hi guys:
We are getting this graph from a webserver and the boos want a deeper explanation of it.
So AFAIK the conn test is a ping; so it will give and idea of how network is working and also can reflect how the server is performing serving request. (Note aside: I feel that TCP connection times from a ping test can be misleading, I mean ping is icmp which people calls 3.5 layer (TCP/IP vs OSI layering) ).
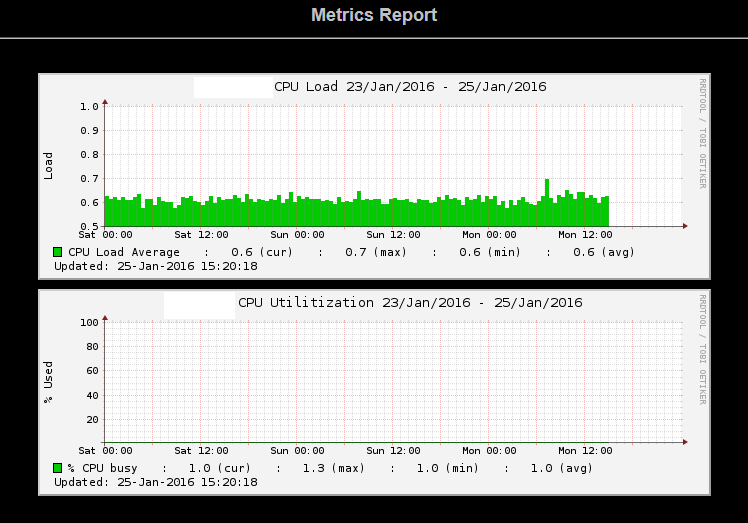
I know 0.02 seconds aren't the world falling; but I'm looking to give and answer that cover the pikes (I guest the metric report issues and average of the data that is plotted?).
RAM is at 90% all time long; but since CPU utilization is too low; like LA I'm tempting to say that we need to drill down to the url that webcache (this is an Oracle WebCache; which works like a reverse proxy for "accelerating" webapps was serving since it may be the cause of the delay.
Any idea or input will really appreciate.
▸
--

CONFIDENCIALIDAD - La información contenida en este mensaje es confidencial y se dirige únicamente a su destinatario. Si usted lector de este mensaje no es ese destinatario, la diseminación, distribución o copia del mismo o sus adjuntos (de existir) se encuentran prohibidos. Si lo ha recibido por error, por favor notifique de manera inmediata por correo y destruya las copias de su correo.
CONFIDENTIALITY STATEMENT - The information contained in this message is confidential and intended only for the addressee. If the reader of this message is not the intended recipient you are notified that any dissemination, distribution or copy of this message and attachments (if any) is strictly prohibited. If you have received this in error, please immediately notify us by reply email, destroy all copies and remove from all media.
Attachments (1)
 attachment-0002.png
list Japheth Cleaver
▸
On Mon, January 25, 2016 1:13 pm, Randall Badilla Castro wrote:
Hi guys:
We are getting this graph from a webserver and the boos want a deeper
explanation of it.

So AFAIK the conn test is a ping; so it will give and idea of how
network is working and also can reflect how the server is performing
serving request. (Note aside: I feel that TCP connection times from a
ping test can be misleading, I mean ping is icmp which people calls 3.5
layer ).
Hi Randall,

The "conn" test is actually just a simple ICMP echo (the "TCP" there is a
misnomer unfortunately; it's being graphed by the 'tcp' RRD interpreter).
The test is identical to the output you'd get from a run of "fping -Ae"
against a list of IP addresses, since that's actually what's happening on
the backend :) (Unless you're using the legacy 'xymonping', but that was
intended to do the same thing.)

[root at localhost ~]# fping -Ae 4.2.2.2 8.8.8.8 127.0.0.1
4.2.2.2 is alive (15.2 ms)
8.8.8.8 is alive (22.4 ms)
127.0.0.1 is alive (0.01 ms)


With your graph in particular, your average is in the microsecond range,
but something bumped up to 18/20ms for long enough to factor into the RRD
averaging for that period. RRD data is less granular over time, but you
might be able to zoom in to get a better idea of the time frames.

It's possible something was happening on your monitor server... a quick
way to rule it out is to see if all other network graphs have the same
problem. More likely, there was an issue somewhere in the network.

The 'conn' test won't normally go red as long the destination is actually
alive (returns a response before fping times out), but you can force an
override by using the 'DS' syntax in analysis.cfg to cause an alert to
happen at any particular arbitrary level:

For details on that, see
https://xymon.com/help/manpages/man5/analysis.cfg.5.html#lbAN


HTH,
-jc
list Daniel Dan McDonald
From: Xymon <xymon-bounces at xymon.com<mailto:xymon-bounces at xymon.com>> on behalf of Randall Badilla Castro <user-911f8b61a6eb@xymon.invalid<mailto:user-911f8b61a6eb@xymon.invalid>>
Organization: GrupoCESA
Date: Monday, January 25, 2016 at 3:13 PM
To: Xymon-users <xymon at xymon.com<mailto:xymon at xymon.com>>
Subject: [Xymon] little explanation of conn test.
▸
Hi guys:
We are getting this graph from a webserver and the boos want a deeper explanation of it.
[cid:user-00f281722395@xymon.invalid]


Ping response times mean almost nothing.  Most O/S will rate-limit ping response, so maybe something else was pinging it at the same time.  Or you may have had some other sort of resource constraint on the server.  But network time moving from 500µ to 20ms?  Unless your packets suddenly decided to route an extra 60km, there is nothing in a network that would consume 20ms