Rare shape in graphs.
Thank you Jeremy, That Interpolation feature explains a lot of things with
RRD files.


On Mon, Apr 29, 2013 at 6:55 AM, Jeremy Laidman <user-71895fb2e44c@xymon.invalid>wrote:
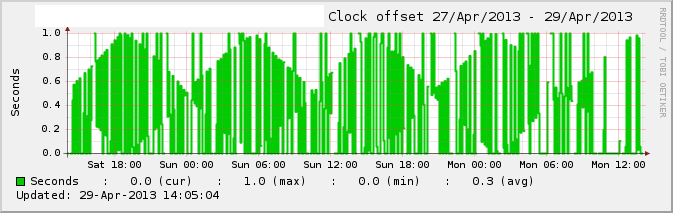
On 23 April 2013 21:33, Raul GN <user-340accf16858@xymon.invalid> wrote:Hi all, Recently I've included 2 new host to monitor in xymon but from time to time response times are quite high (2 o 3 seconds). Shape in graphs draws ups and downs in a very recognisable manner:I believe this is a result of quantization and interpolation when RRD stores the results, and it shows up when RRD creates the graphs. It also seems more pronounced when the metrics are whole-numbers, such as clock offset. It's also more obvious for really small numbers. Here's a graph of mine that shows an interesting repeating diamond shape. [image: Inline images 1] (But your multi-coloured "Connection Times" graph is far prettier.) This took me a while to understand what's going on, and I still don't quite get it. But by way of an example, let's say that the clock offset (error) of a host is 2.333 seconds relative to the Xymon server. But let's say the quantization causes RRD to accept only whole numbers (I'm stretching the truth here for demonstration purposes). The numbers will come in as 2.333, 2.333, 2.333, but RRD will store them as 2, 2, 3, 2, 2, 3. So you end up with a repeating pattern (a spike every 3rd sample) that really doesn't exist, and is related to the way RRD stores, consolidates and retrieves numbers. This pattern is easily detected by our brain vision circuitry. Of course, RRD can indeed store floating point numbers, but when you have really small variations in numbers (many decimal places), RRD has to round the numbers at some point, and this gives the same effect. Also, the number of decimal places required to avoid such effects is increased when you do averaging and interpolation. Interpolation, the way I see it, is as follows. When RRD gets a value of 7 at 3:05:00 and a value of 8 at 3:10:01, it doesn't store "8" for the second value, because it didn't come in exactly 5 minutes after the first value. Instead, RRD removes one second's worth from the value, because it has to store the second value at 3:10:00. If it took 301 seconds to go from 7 to 8, then RRD will calculate that the value after 300 seconds would have been around 7.996... So if your sampling jumps around a little earlier and later, in a regular manner, you may see an interpolation artefact that matches that variation. Typically, xymonnet performs its checks in the same order every time, and earlier checks might delay later checks very slightly, just enough to push the sample timestamp into the next whole second, causing an interpolation artefact. Because the ordering is not randomised, the artefacts are consistent and recognisable as patterns in the graphs. It could be that, by adding "--shuffle" to the call to xymonnet, the artefacts will no longer form a recognisable pattern. While I don't fully understand what's going on, I think it's safe to say that it's not a problem with either Xymon or the servers being tested, but is a result of how RRD does its thing. J
Attachments (1)
 attachment.png