Graphing temperature with Devmon issues
Typo,
Xymon 4.3.30 (but have the same issue in both versions)
On Sat, Jan 25, 2025 at 2:26 PM Ken Connell <user-db108f93c7f6@xymon.invalid> wrote:
Trying to graph temperature, it's a single OID that is polled successfully, but graph data notes the changes and separate values instead of graphing the changes as a whole.Xymon 4.3.28 with Devmon 0.3.1-beta1(I am working on the newer Devmon version, but haven't gotten far enough with that version to implement yet).For RRD data - I get multiple files for the host/test:temperature.CPU:_44.rrdtemperature.CPU:_45.rrdSnip from graphs.cfg (only thing I changed is the scale):[temperature]
FNPATTERN ^temperature.(.+).rrd
TITLE Temperature
YAXIS Celsius
-u 100 <-- only change
DEF:p@RRDIDX@=@RRDFN@:temperature:AVERAGE
LINE2:p@RRDIDX@#@COLOR@:@RRDPARAM@
GPRINT:p@RRDIDX@:LAST: \: %5.1lf (cur)
GPRINT:p@RRDIDX@:MAX: \: %5.1lf (max)
GPRINT:p@RRDIDX@:MIN: \: %5.1lf (min)
GPRINT:p@RRDIDX@:AVERAGE: \: %5.1lf (avg)\nWhat am I missing here?
--
Ken Connell
Senior Network Engineer
Computer & Communication Services
Toronto Metropolitan University (Formerly Ryerson University)
--
Ken Connell
Senior Network Engineer
Computer & Communication Services
Toronto Metropolitan University (Formerly Ryerson University)
Attachments (1)
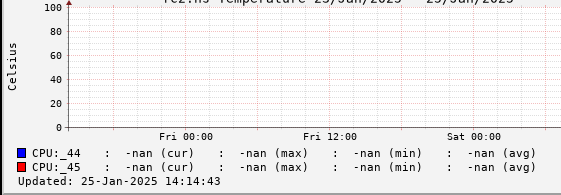 image.png