Problem with external script and RRD-Graphs
Hi Tom Brand,

can you please send me your mysqlstat script? I realy need to fix this issue
as fast as possible... til now I couldnt solve this. I hope with your script
I can make it work.**

TIA,

Cayo de Moraes


2009/5/27 Brand, Thomas R. <user-10a840458972@xymon.invalid>
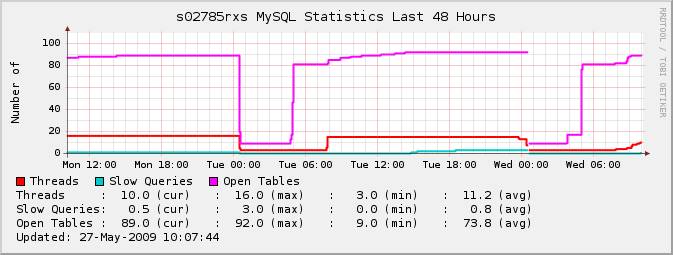
After editing the hobbitserver.cfg and hobbitgraph.cfg i had some
confrontations with:

how should i configure the parameters of the hobbitserver.cfg and
hobbitgraph.cfg if i want 3 diferent
graphs in one page, when the graph name has to be the same as the column name? when trying to get the only graph into the browser i get only an 1x1Pixel graph... I can’t help with the multiple graphs on one page; I have mine set up for one graph on the page. If you’re intererested, I can send you my version of bb-mysqlstat.sh (heavily modified from the one available on Deadcat.net …. ) Here are the relevant parts from hobbitserver.cfg: NCV_mysql="Threads:GAUGE,SlowQueries:GAUGE,OpenTables:GAUGE,FlushTables:NONE,Questions:NONE,Opens:NONE,AvgQuerysPerSecond:NONE,Uptime:NONE,FreeBufferPool:NONE" GRAPHS="la,disk,inode,qtree,files,processes,memory,users,vmstat,iostat,tcp.http,tcp,ncv,netstat,ifstat,mrtg::1,ports,temperature,ntpstat,apache,bind,sendmail,mailq,socks,bea,iishealth,citrix,bbgen,bbtest,bbproxy,hobbitd,clock,lines,mysql" Here is the stanza from my hobbitgraph.cfg for the mysql graphs: [mysql] TITLE MySQL Statistics YAXIS Number of DEF:threads=mysql.rrd:Threads:AVERAGE DEF:slow=mysql.rrd:SlowQueries:AVERAGE DEF:opentables=mysql.rrd:OpenTables:AVERAGE LINE2:threads#FF0000:Threads LINE2:slow#00CCCC:Slow Queries LINE2:opentables#FF00FF:Open Tables COMMENT:\n GPRINT:threads:LAST:Threads \: %5.1lf (cur) GPRINT:threads:MAX: \: %5.1lf (max) GPRINT:threads:MIN: \: %5.1lf (min) GPRINT:threads:AVERAGE: \: %5.1lf (avg)\n GPRINT:slow:LAST:Slow Queries\: %5.1lf (cur) GPRINT:slow:MAX: \: %5.1lf (max) GPRINT:slow:MIN: \: %5.1lf (min) GPRINT:slow:AVERAGE: \: %5.1lf (avg)\n GPRINT:opentables:LAST:Open Tables \: %5.1lf (cur) GPRINT:opentables:MAX: \: %5.1lf (max) GPRINT:opentables:MIN: \: %5.1lf (min) GPRINT:opentables:AVERAGE: \: %5.1lf (avg)\n The client side extension script sends up the information which is then displayed as: *Wed May 27 10:12:53 EDT 2009 - mySQL is OK* Threads : 10 Slow Queries : 1 Open Tables : 89 Flush Tables : 1 Questions : 83279 Opens : 94 AvgQuerysPerSecond : 2.455 Uptime : 33923 Free Buffer Pool : 62 Hope this helps, *Tom Brand* *CVS/pharmacy* *IS Rx SysAdmin Store Support* *From:* Cayo de Moraes [mailto:user-92aec3b3c467@xymon.invalid] *Sent:* Wednesday, May 27, 2009 5:06 AM *To:* user-ae9b8668bcde@xymon.invalid *Subject:* [hobbit] Problem with external script and RRD-Graphs Hi guys, im trying to monitor some mysql performances like slowqueries, threads, queries per second, etc. trought an external script. So far i get all results from the client (Big Brother-Client) unless the graphs. Using big brother (server) i get 3 graphs (slowqueries, threads and queries per second) but after migrating BB to Hobbit i cant get any graph anymore. I already did all steps from "How to setup custom graphs" but its not working. Did i forget something / did something wrong or is it with the BB-Client not possible? After editing the hobbitserver.cfg and hobbitgraph.cfg i had some confrontations with: how should i configure the parameters of the hobbitserver.cfg and hobbitgraph.cfg if i want 3 diferent graphs in one page, when the graph name has to be the same as the column name? when trying to get the only graph into the browser i get only an 1x1 Pixel graph... has anybody any idea?? TIA
Attachments (1)
 attachment.jpg