Question Regarding TCP Statistics Graph
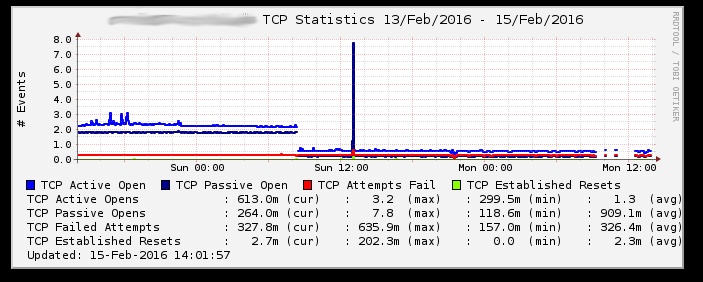
Hello,

I'm a bit confused on what exactly this TCP Statistics graph is saying
(image attached).

What exactly are the units in this graph?

The y axis shows ~1-2 events but the legend shows 100-600"m".  What is the
magnitude of "m" exactly?

Do the numbers in the legend not line up with the graph axis units? Is
there a reason for this?


I would greatly appreciate if anyone could clear this up for me!


Thanks!!

--
Matt Vander Werf
Attachments (1)
 attachment.png