Rare shape in graphs.
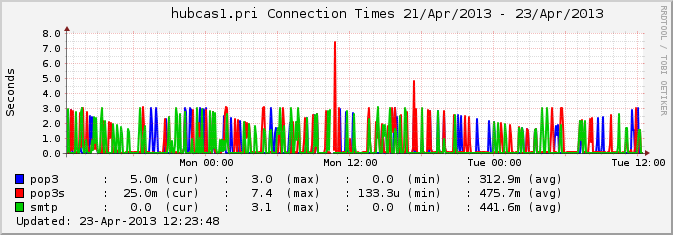
Hi all,
   Recently I've included 2 new host to monitor in xymon but from time to
time response times are quite high (2 o 3 seconds). Shape in graphs draws
ups and downs in a very recognisable manner:

[image: Inline image 1]
[image: Inline image 2]

Testing the host (a windows server) with telnet for hours (Perl script)
doesn't shows this responses times (always fewer than 1 second). Does
anyone knows where could be the problem? Is it a xymon server problem or it
may be in the remote server?  I think it is in the remote server but I
couldn't demonstrate it and than curious graphs doesn't help clarifying it.
Attachments (2)
 attachment.png
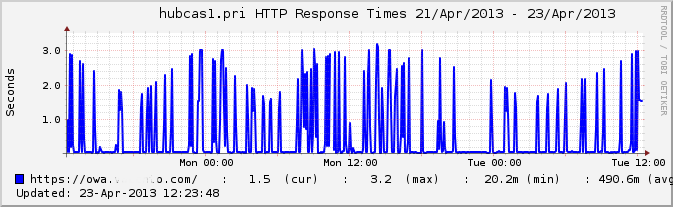 attachment-0001.png