curves went to zero but didn't have a report?
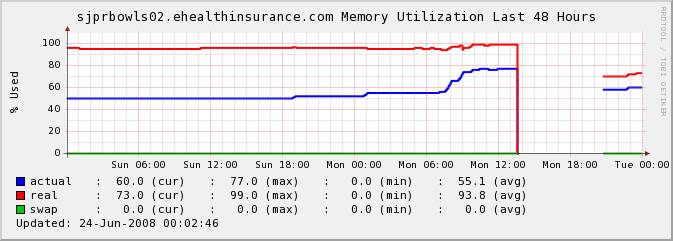
Looking at this graph, there is always some memory utilization and some
CPU utilization (seen via load average).  I think the real problem is
that something went wrong with the agent on this machine, or it could no
longer communicate with the Hobbit server during this time period. You
should review the alert history for this node and then make sure that
you configure alerts appropriately.  I suspect that you will find that
all of the agent-based tests went "purple" at about 1:30.  The other
thing to check is the "conn" column -- if the system was not reachable,
then the purple alarms for the agent-based tests would have been
suppressed in favor of the reachability alarm.


	From: Andrew Chen [mailto:user-2a0ed696254e@xymon.invalid]
	Sent: Tuesday, June 24, 2008 3:17 AM
	To: user-ae9b8668bcde@xymon.invalid
	Subject: [hobbit] curves went to zero but didn't have a report?


	Let's take a look at the CPU and Memory charts for this machine:

	At around 01:00pm, the curves went to zero.


	   Above, the cpu and memory used 0, but I didn't recevie a RED
Alert report and email. (if there is some mothed to check this problem).

	Hobbit-client configured file

	   UP 1h 22w

	   LOAD 5.0 15.0

	   DISK / 80 90

	   DISK /boot 80 90

	   DISK /var 80 90

	 DISK /data 80 90

	   MEMSWAP 40 60

	   MEMACT 80 90

	 MEMPHYS 101 101

	This configuration only reported when the cpu and memory reach
5.0(cpu) and 80(memory), then they will send a alert report and email.
But I can't find about cpu and memory used 0, then send an alert report
and email. Can you teach me how to do it? Thanks.
Attachments (2)
 attachment.jpg
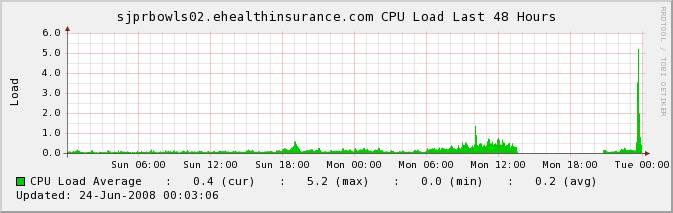 attachment-0001.jpg