Monitoring iostat performance
On Wed, January 29, 2014 2:55 pm, Lists wrote:
Recently, we had a publicly visible outtage as a result of one of our
load balancers exceeding the IOPS capability of its system drives. We'd
like to extend xymon (currently installed on CentOS6 /32 with defaults)
so that it can monitor IOPS for all servers.

Specifically, we'd like to see wrqm/s and probably %util. What's the
most straightforward way to accomplish this? The other alternative is to
create some form of internal script, which is doable but not preferable
if there's an off-the-shelf tool available.
Not specifically "off-the-shelf", but it's not too difficult to script it
up. We do it in a three-step process due to load, but it could be done
more simply with custom script on the servers themselves that combine #1
and #2 together and send trends messages back to xymond directly.
1) Add iostat/iostatx into xymonclient-linux.sh via the /local/ directory.
We have the following two scripts in place:
[localhost:~xymon/local/]$ head iostat*
==> iostat <==
#!/bin/sh
# iostat is in the sysstat package
echo "iostat -N 300 2 1>$XYMONTMP/xymon_iostat.$MACHINEDOTS.$$ 2>&1; mv
$XYMONTMP/xymon_iostat.$MACHINEDOTS.$$ $XYMONTMP/xymon_iostat.$MACHINEDOTS
2>&1" | nohup sh >/dev/null &
if test -f $XYMONTMP/xymon_iostat.$MACHINEDOTS; then cat
$XYMONTMP/xymon_iostat.$MACHINEDOTS; rm -f
$XYMONTMP/xymon_iostat.$MACHINEDOTS; fi
==> iostatx <==
#!/bin/sh
# iostat is in the sysstat package
echo "iostat -Nx 300 2 1>$XYMONTMP/xymon_iostatx.$MACHINEDOTS.$$ 2>&1; mv
$XYMONTMP/xymon_iostatx.$MACHINEDOTS.$$
$XYMONTMP/xymon_iostatx.$MACHINEDOTS 2>&1" | nohup sh >/dev/null &
if test -f $XYMONTMP/xymon_iostatx.$MACHINEDOTS; then cat
$XYMONTMP/xymon_iostatx.$MACHINEDOTS; rm -f
$XYMONTMP/xymon_iostatx.$MACHINEDOTS; fi
That looks scary, but it basically what the vmstat lines in the built-in
code are doing (although we alter it so the output of 'ps' looks cleaner).
This results in sections labelled "[iostat]" and "[iostatx]" (well,
'[local:iostat]') in the client data stream for the server.
2) We have a separate script that listens on the "client" channel via
xymond_channel and looks for linux systems with the above section in them
(which is the raw output of the iostat command(s)). It munges those into a
"trends" data message like this:
data <hostname>.trends
[iostatx.sda.rrd]
DS:reads:GAUGE:600:0:U 1036.10
DS:writes:GAUGE:600:0:U 534.77
DS:util:GAUGE:600:0:U 100.00
[iostatx.rootvg-rootlv.rrd]
DS:reads:GAUGE:600:0:U 0.00
DS:writes:GAUGE:600:0:U 3.31
DS:util:GAUGE:600:0:U 0.01
[iostatx.rootvg-swaplv.rrd]
DS:reads:GAUGE:600:0:U 0.00
DS:writes:GAUGE:600:0:U 0.00
DS:util:GAUGE:600:0:U 0.00
[iostatx.rootvg-glidelv.rrd]
DS:reads:GAUGE:600:0:U 1036.10
DS:writes:GAUGE:600:0:U 534.26
DS:util:GAUGE:600:0:U 100.00
3) xymond_rrd does what it needs to do to turn these into RRD files, and
we have config files in /graphs.d/ to print them nicely:
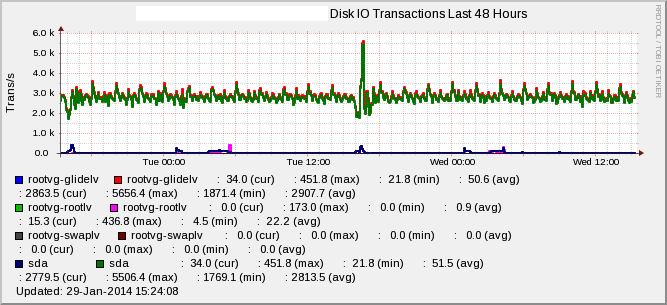
[iostatx]
FNPATTERN ^iostatx.(.*).rrd
TITLE Disk IO Transactions
YAXIS Trans/s
DEF:r at RRDIDX@=@RRDFN@:reads:AVERAGE
DEF:w at RRDIDX@=@RRDFN@:writes:AVERAGE
LINE2:r at RRDIDX@#@COLOR@:@RRDPARAM@
LINE2:w at RRDIDX@#@COLOR@:@RRDPARAM@
GPRINT:r at RRDIDX@:LAST: \: %5.1lf (cur)
GPRINT:r at RRDIDX@:MAX: \: %5.1lf (max)
GPRINT:r at RRDIDX@:MIN: \: %5.1lf (min)
GPRINT:r at RRDIDX@:AVERAGE: \: %5.1lf (avg)\n
GPRINT:w at RRDIDX@:LAST: \: %5.1lf (cur)
GPRINT:w at RRDIDX@:MAX: \: %5.1lf (max)
GPRINT:w at RRDIDX@:MIN: \: %5.1lf (min)
GPRINT:w at RRDIDX@:AVERAGE: \: %5.1lf (avg)\n
[iostatusage]
FNPATTERN ^iostatx.(.*).rrd
TITLE Disk IO Utilization
YAXIS % Utilization
DEF:u at RRDIDX@=@RRDFN@:util:AVERAGE
LINE2:u at RRDIDX@#@COLOR@:@RRDPARAM@
-u 100
-l 0
GPRINT:u at RRDIDX@:LAST: \: %5.1lf (cur)
GPRINT:u at RRDIDX@:MAX: \: %5.1lf (max)
GPRINT:u at RRDIDX@:MIN: \: %5.1lf (min)
GPRINT:u at RRDIDX@:AVERAGE: \: %5.1lf (avg)\n
4) xymond_rrd can alert directly out of these using the 'DS' option in
analysis.cfg files to override an existing test (we use 'disk', since it
seems to make the most sense).
That's basically it.... The results look like the graphs attached. Hope
this helps!
-jc
Attachments (2)
 attachment.png
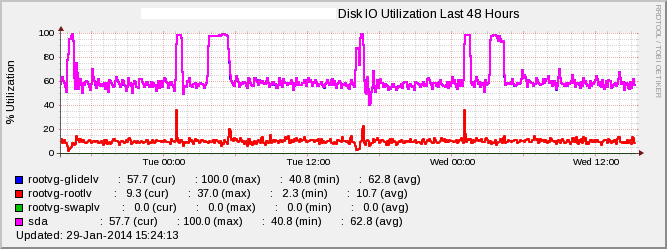 attachment-0001.png