performance help needed
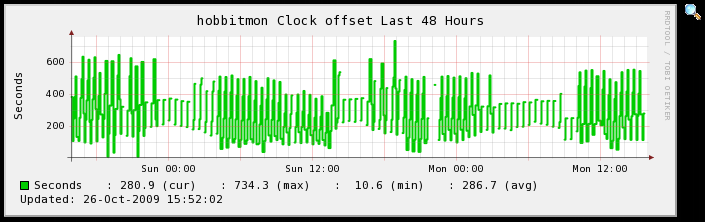
Hi all,


First off, sorry for the long post, I'm trying to supply as much data as
possible for analysis.


I have a single Hobbit server with approximately 3500 hosts, a mixture
of windows and unix, some DB tests,

some BEA tests and a few custom tests.  I have over 70000 RRD files
which seems to be causing Hobbit performance

problems, most specifcally clock offset.  I have a cron job that
restarts Hobbit every 30 minutes otherwise the offset

grows so large it eats all memory and OOM kill starts.  NTP is fine, it
seems to be the time it takes for Hobbit to process

the client data.  OS resides on RAID1 146GB drives SAS 15K RPM, second
drive for RRDs is a single 300GB SAS 15K RPM.

At the end is a graph showing the clock offset.  What else can I try?


I moved the RRDs off to a separate drive hoping this would help, but the
write per second is high.  I've tried reducing

read-ahead, mounting noatime,nodiratime, changing IO scheduling to
deadline, nothing seems to help.  Here's a

sample output from iostat -xd 60 10:

Device:

rrqm/s

wrqm/s

r/s

w/s

rsec/s

wsec/s

rkB/s

wkB/s

avgrq-sz

avgqu-sz

await

svctm

%util

sda

0.00

68.08

0.17

20.02

1.33

704.78

0.67

352.39

34.98

4.25

210.36

3.47

7.01

sda1

0.00

0.00

0.00

0.00

0.00

0.00

0.00

0.00

0.00

0.00

0.00

0.00

0.00

sda2

0.00

68.08

0.17

20.02

1.33

704.78

0.67

352.39

34.98

4.25

210.36

3.47

7.01

sdb

0.00

674.60

1.53

311.04

12.27

7887.05

6.13

3943.52

25.27

24.50

78.38

1.91

59.70

sdb1

0.00

674.60

1.53

311.04

12.27

7887.05

6.13

3943.52

25.27

24.50

78.38

1.91

59.70

sdb2

0.00

0.00

0.00

0.00

0.00

0.00

0.00

0.00

0.00

0.00

0.00

0.00

0.00

dm-0

0.00

0.00

0.17

88.10

1.33

704.78

0.67

352.39

8.00

20.31

230.09

0.79

7.01

dm-1

0.00

0.00

0.00

0.00

0.00

0.00

0.00

0.00

0.00

0.00

0.00

0.00

0.00


Drive sdb1 is housing the RRD files


Memory seems fine:

Memory              Used       Total  Percentage
  Physical           7645M       7973M         95%
 Actual             4688M       7973M         58%
 Swap                 64M       9983M          0%


[hobbit at hobbitmon rrd]$ uname -a

Linux hobbitmon 2.6.9-78.0.8.ELsmp #1 SMP Wed Nov 5 07:14:58 EST 2008
x86_64 x86_64 x86_64 GNU/Linux

[hobbit at hobbitmon rrd]$ cat /etc/redhat-release

Red Hat Enterprise Linux AS release 4 (Nahant Update 7)


Output from bbgen:

bbgen for Hobbit version 4.2.0


Statistics:

 Hosts               :  3506

 Status messages     : 41934

 Purple messages     :     0

 Pages               :   171


Output from bbtest:

bbtest-net version 4.2.0
SSL library : OpenSSL 0.9.7a Feb 19 2003
LDAP library: OpenLDAP 20213

Statistics:
 Hosts total           :     3511
 Hosts with no tests   :     2390
 Total test count      :     1470
 Status messages       :     1596
 Alert status msgs     :        0
 Transmissions         :       18

DNS statistics:
 # hostnames resolved  :      358
 # succesful           :      339
 # failed              :       19
 # calls to dnsresolve :      530

TCP test statistics:
 # TCP tests total     :      411
 # HTTP tests          :      161
 # Simple TCP tests    :      250
 # Connection attempts :      411
 # bytes written       :    24722
 # bytes read          :   543706


TIME SPENT
Event                                            Starttime
Duration
bbtest-net startup                       1256584823.382254
• Service definitions loaded               1256584823.383506
0.001252
Tests loaded                             1256584823.468743
0.085237
DNS lookups completed                    1256584828.565010
5.096267
Test engine setup completed              1256584828.572444
0.007434
TCP tests completed                      1256584839.000192
10.427748
PING test completed (1082 hosts)         1256584881.612835
42.612643
PING test results sent                   1256584890.617168
9.004333
Test result collection completed         1256584890.617453
0.000285
LDAP test engine setup completed         1256584890.617453
0.000000
LDAP tests executed                      1256584890.617454
0.000001
LDAP tests result collection completed   1256584890.617455
0.000001
NTP tests executed                       1256584894.477007
3.859552
RPC tests executed                       1256584894.988810
0.511803
Test results transmitted                 1256584895.016358
0.027548
bbtest-net completed                     1256584895.018441
0.002083
TIME TOTAL
71.636187


Output for hobbitd:
Statistics for Hobbit daemon
Up since 26-Oct-2009 15:00:11 (0 days, 00:25:02)

Incoming messages      :     398039
- status               :     367373
- combo                :       5193
- page                 :        183
- summary              :         75
- data                 :      15310
- client               :       9595
- notes                :          0
- enable               :          0
- disable              :          0
- ack                  :          0
- config               :          0
- query                :         50
- hobbitdboard         :         63
- hobbitdlog           :        180
- drop                 :          0
- rename               :          0
- dummy                :          5
- ping                 :          0
- notify               :          0
- schedule             :          1
- download             :          0
- Bogus/Timeouts       :         11
Incoming messages/sec  :        262 (average last 300 seconds)

status channel messages:     366410 (1 readers)
stachg channel messages:      34214 (1 readers)
page   channel messages:       5600 (1 readers)
data   channel messages:      15310 (1 readers)
notes  channel messages:          0 (0 readers)
enadis channel messages:          0 (0 readers)
client channel messages:       9565 (1 readers)
clichg channel messages:         17 (1 readers)
Attachments (1)
 attachment.png