Graph colors
Yes you can, but only for a single graph (not multi-graphs like disks).
You can't do calculations to adjust the graph COLOR value, but you can draw
more than one graph so that one hides the other and gives the impression of
changing colours.
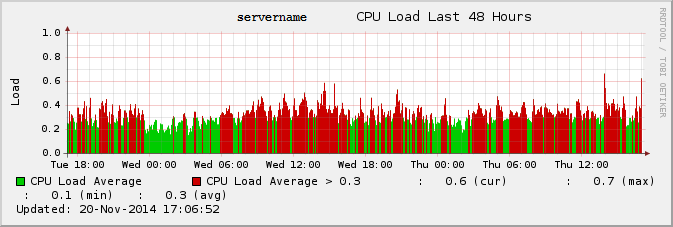
Example 1:
[image: Inline images 1]
This is the config I used, based on the standard [la] definition:
[la]
TITLE CPU Load
YAXIS Load
DEF:avg=la.rrd:la:AVERAGE
CDEF:la=avg,100,/
CDEF:la_lo=la,0.3,MIN
AREA:la#CC0000:CPU Load Average
AREA:la_lo#00CC00:CPU Load Average > 0.3
-u 1.0
GPRINT:la:LAST: \: %5.1lf (cur)
GPRINT:la:MAX: \: %5.1lf (max)
GPRINT:la:MIN: \: %5.1lf (min)
GPRINT:la:AVERAGE: \: %5.1lf (avg)\n
What's happening here is that I draw two AREA graphs, the first one showing
the normal graph in red, and the second one (which goes in front of the
first) with a cap of 0.3 (using "MIN"). So you can see the reds peeking
out above the greens.
Example 2:
[image: Inline images 2]
This is the config I used:
[la]
TITLE CPU Load
YAXIS Load
DEF:avg=la.rrd:la:AVERAGE
CDEF:la=avg,100,/
CDEF:la_hi=la,0.3,LT,0,la,IF
AREA:la#00CC00:CPU Load Average
AREA:la_hi#CC0000:CPU Load Average > 0.3
-u 1.0
GPRINT:la:LAST: \: %5.1lf (cur)
GPRINT:la:MAX: \: %5.1lf (max)
GPRINT:la:MIN: \: %5.1lf (min)
GPRINT:la:AVERAGE: \: %5.1lf (avg)\n
What's going on here is that I define a new variable "la_hi" which is set
to the value of "la", but is then set to zero if it's less than than the
threshold - in other words, untouched only if it equals or exceeds the
threshold.
Then I graph the standard "la" graph, and in front of that, I graph the new
"la_hi" graph. Where the "la_hi" is zero, you see the "la" graph peeking
through.
Cheers
Jeremy
On 20 November 2014 11:47, Steve Brown <user-a23886790dfc@xymon.invalid> wrote:
 Is it possible to have a custom graph display different colors based on
the value and if so can someone help show how?


For example if the value of the graph is

0-80 then color = yellow

81-100 then color = green


TIA

Steve
Attachments (2)
 attachment.png
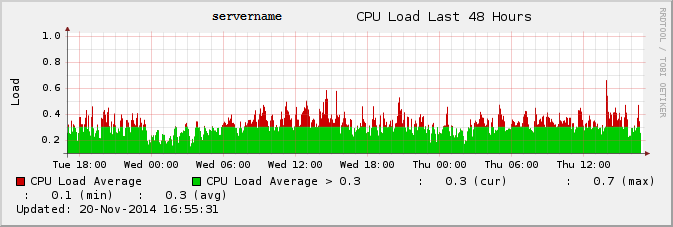 attachment-0001.png