TS - RRD Graph incorrect
I am trying to graph the number of users on our Juniper SSL-VPN.
I am sending the value pairs as: sslvpn : 227 ,etc.
I am having a problem with the graph definition:
[sslvpn]
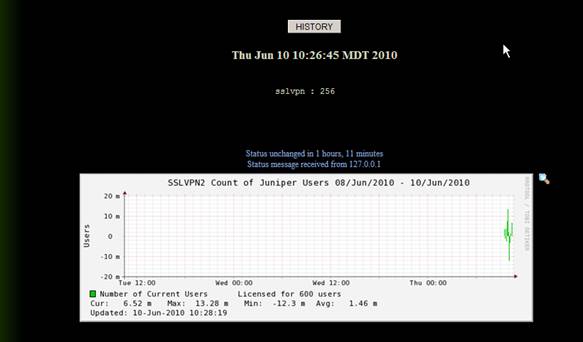
TITLE Count of Juniper Users
YAXIS Users
DEF:in=sslvpn.rrd:sslvpn:AVERAGE
AREA:in#00CC00:Number of Current Users
COMMENT: Licensed for 600 users\n
GPRINT:in:LAST:Cur\: %6.2lf %s
GPRINT:in:MAX: Max\: %6.2lf %s
GPRINT:in:MIN: Min\: %6.1lf %s
GPRINT:in:AVERAGE:Avg\: %6.2lf %s\n
The Graph has a bad YAXIS.
I need it to show the number of users and if possible a line in RED
showing 600 as this is the License limit.
I need assistance in getting the YAXIS values to be a number from
zero(0) on up.
Is it possible to also place a static line at the 600 value across the
graph?
Thanks,
Tom Schmitt
Senior IT Staff - R&D
L-3 Communication Systems West
640 North 2200 West
P.O. Box 16850
Salt Lake City, UT XXXXX
Phone (XXX) XXX-XXXX
Cell (XXX) XXX-XXXX
eFax (XXX) XXX-XXXX
user-9c1ae820b621@xymon.invalid
\\\\||////
\ ~ ~ /
| @ @ |
--oOo---(_)---oOo--
Attachments (1)
 attachment.jpg